
Cannabis Price Index – May 11: Prices Hold Steady as Catalogue Narrows
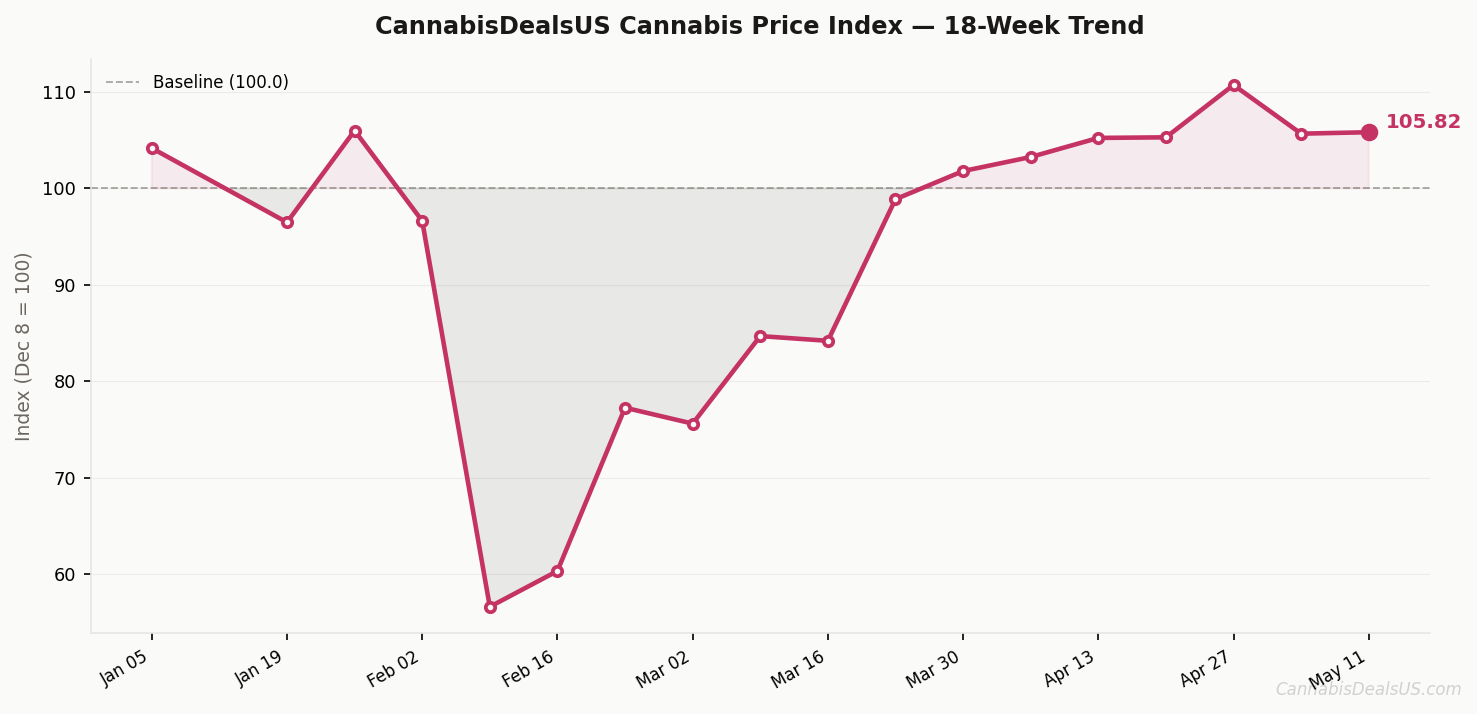
The CannabisDealsUS Cannabis Price Index rose to 105.82, placing prices 5.82% above the December 2025 baseline, as the tracked catalogue contracted by approximately 6,000 SKUs concentrated in the premium price tier.
The CannabisDealsUS Cannabis Price Index tracked 35,644 online cannabis products this week, with the market average settling at $58.58 per product and active discounting below 0.1% across all categories. Prices remain 5.82% above the December 2025 baseline. Despite a catalogue update event that reduced tracked SKU count from 41,638 to 35,644, average prices held near-flat (+$0.08 week-on-week), with Rolling Papers recording the sharpest subcategory movement at +4.1%.
Fewer than 1% of products carry active discounts this week, with no measurable average discount depth across the overall catalogue.
The effective market-wide discount rate is below 0.1%, confirming a structurally full-price market where listed prices reflect standard retail pricing.
This Week at a Glance
| Metric | Value | Prior Week | WoW |
|---|---|---|---|
| Avg Effective Price | $58.58 | $58.50 | +$0.08 |
| Avg Discount | <0.1% | <0.1% | Stable |
| Products Tracked | 35,644 | 41,638 | -5,994* |
| Index Value | 105.82 | 105.67 | +0.15 |
* Catalogue update event this week; SKU contraction concentrated in premium tier. Price movements in affected subcategories may reflect composition changes, not market price shifts.
14-Week Index Trend

The index has sustained a position above baseline since late March 2026, with this week’s near-flat reading (+0.15 points) indicating that the catalogue contraction did not compress average pricing. The April peak of 110.72 has moderated, and the index now holds in a stable 105–106 band.
| Week | Avg Price | Index Value |
|---|---|---|
| Feb 9, 2026 | $57.91 | 56.59 |
| Feb 16, 2026 | $55.71 | 60.30 |
| Feb 23, 2026 | $57.67 | 77.24 |
| Mar 2, 2026 | $53.40 | 75.59 |
| Mar 9, 2026 | $58.68 | 84.67 |
| Mar 16, 2026 | $53.48 | 84.18 |
| Mar 23, 2026 | $54.73 | 98.87 |
| Mar 30, 2026 | $56.35 | 101.79 |
| Apr 6, 2026 | $57.16 | 103.25 |
| Apr 13, 2026 | $58.25 | 105.23 |
| Apr 20, 2026 | $58.29 | 105.29 |
| Apr 27, 2026 | $61.29 | 110.72 |
| May 4, 2026 | $58.50 | 105.67 |
| May 11, 2026 | $58.58 | 105.82 |
Quote-Ready Insights
“The CannabisDealsUS Cannabis Price Index tracked 35,644 products this week with an average price of $58.58, holding within $0.10 of last week’s reading despite a 14% reduction in tracked catalogue size. Price stability under catalogue compression is a signal of underlying market consistency.”
“Rolling Papers recorded the largest week-on-week price movement in our subcategory data at +4.1%, while every other major subcategory held within 1% of prior-week pricing. That kind of concentration in a single accessory subcategory is worth tracking over the coming weeks.”
“Fewer than 1% of tracked products carry any active discount, and the effective market-wide discount rate is below 0.1%. Online cannabis retail continues to operate primarily on standard list pricing,” said Theo Valmis, founder of CannabisDealsUS.
Segment Takeaways
CBD: Prices anchored with minor catalogue contraction across most subcategories; CBD Oil leads at $81.10 average, unchanged from prior week.
THC: Pre-Rolls ($20.05) and Capsules ($17.37) remain the most affordable entry points; THC Flower held at $98.26 with no price movement.
Headshop: Broad catalogue coverage with stable pricing; Rolling Papers posted the only meaningful WoW price move at +4.1%, driven by SKU composition shift.
CBD & THC Market Snapshot
| Segment | Avg Price | Avg Discount | Products |
|---|---|---|---|
| Overall | $58.58 | <0.1% | 31,890 |
| CBD | $60.08 | 0% | 1,950 |
| THC | $36.28 | 0% | 6,619 |
| Headshop | $65.31 | 0% | 19,569 |
CBD Subcategories
| Subcategory | Avg Price | Avg Discount | Products | WoW Price |
|---|---|---|---|---|
| CBD Capsules | $42.46 | 0% | 131 | $0.00 (0%) |
| CBD Creams | $43.06 | 0% | 259 | $0.00 (0%) |
| CBD Edibles | $50.35 | 0% | 541 | +$0.39 (+0.8%)* |
| CBD For Pets | $29.15 | 0% | 142 | $0.00 (0%) |
| CBD Oil | $81.10 | 0% | 604 | +$0.47 (+0.6%)* |
| CBD Vape | $67.94 | 0% | 282 | -$0.29 (-0.4%)* |
* SKU composition changed this week (catalogue update event); WoW price movements may reflect product mix, not market price shifts.
THC Subcategories
| Subcategory | Avg Price | Avg Discount | Products | WoW Price |
|---|---|---|---|---|
| THC Capsules | $17.37 | 0% | 51 | $0.00 (0%) |
| THC Edibles | $36.60 | 0% | 1,629 | +$0.26 (+0.7%)* |
| THC Flower | $98.26 | 0% | 672 | $0.00 (0%) |
| THC Oil | $94.57 | 0% | 109 | $0.00 (0%) |
| THC Pre-Rolls | $20.05 | 0% | 1,060 | $0.00 (0%) |
| THC Vape | $34.79 | 0% | 3,224 | +$0.04 (+0.1%)* |
* SKU composition changed this week (catalogue update event).
Headshop, Grow & Vaporizer Subcategories
| Subcategory | Avg Price | Avg Discount | Products | WoW Price |
|---|---|---|---|---|
| Bongs & Water Pipes | $78.82 | 0% | 8,337 | +$0.03 (0%)* |
| Bongs & Water Pipes† | $39.16 | 0% | 1,266 | -$0.12 (-0.3%)* |
| Cleaning & Maintenance | $30.56 | 0% | 325 | $0.00 (0%) |
| Dab Rigs | $86.70 | 0% | 2,782 | $0.00 (0%)* |
| Grinders | $33.49 | 0% | 1,937 | +$0.01 (0%)* |
| Incense ‡ | $2.95 | 0% | 13 | $0.00 (0%) |
| Lighters ‡ | $88.63 | 0% | 11 | $0.00 (0%) |
| Rolling Papers | $35.86 | 0.04% | 446 | +$1.42 (+4.1%)* |
| Scales ‡ | $19.99 | 0% | 1 | $0.00 (0%) |
| Trays & Storage | $26.03 | 0.01% | 4,194 | +$0.01 (0%)* |
| Grow | $78.50 | 0% | 1,463 | $0.00 (0%)* |
| Vaporizers | $97.60 | 0% | 2,411 | $0.00 (0%)* |
* SKU composition changed this week (catalogue update event); interpret WoW price movement with caution.
† Two “Bongs & Water Pipes” rows reflect distinct SKU sets from separate catalogue sources; normalization in progress.
‡ Low sample (fewer than 50 SKUs) — interpret with caution.
Price Distribution

Most products cluster in the premium tier ($75+) at 59.4%, though this share declined from 65.2% last week as premium-tier SKUs exited the catalogue. Budget products (<$25) rose from 18.8% to 22%, and mid-range ($25–$75) rose from 16.0% to 18.7%, both driven by relative catalogue composition shift rather than individual product price movement.
Average Price by Subcategory

Average Discount by Subcategory

What to Watch
- Catalogue composition vs. index stability: This week’s premium-tier SKU exit (~6,000 products) did not shift the index meaningfully (+0.15 points), confirming price levels are holding independent of catalogue volume. Next week will show whether the contraction stabilizes or continues.
- Rolling Papers price movement: The +4.1% weekly price rise is the sharpest single-subcategory move this week; with only 446 SKUs and a catalogue update event, watch for reversal or confirmation at next week’s reading before treating this as a market signal.
- CBD Edibles SKU contraction: A 38% reduction in tracked CBD Edibles SKUs (868 to 541) alongside a minor price increase (+0.8%) may indicate a merchant catalogue refresh; two consecutive weeks under the new composition are needed before directional price claims can be made.
How to Cite This Index
CannabisDealsUS Cannabis Price Index — a weekly structured dataset tracking online cannabis retail pricing across 30,000+ products from 200+ verified U.S. merchants and brands. Archived on Zenodo with a persistent DOI for reproducible research and policy citation.
Zenodo DOI (all versions):
https://doi.org/10.5281/zenodo.18351089
This concept DOI always resolves to the latest weekly release.
License: CC BY-NC 4.0
Need full CPI dataset access?
Get extended CPI data, historical exports, and deeper insights.
Explore More
- How the Cannabis Price Index Works
- Cannabis Price Index Use Cases
- How Cannabis Pricing Works Online
- How Cannabis Discounts Really Work
Published by Theo Valmis, Founder, CannabisDealsUS.
Last Updated on May 18, 2026 by Theo Valmis