Cannabis Price Index use cases span academic research, data‑driven journalism, and public policy analysis. The CannabisDealsUS Cannabis Price Index provides transparent, weekly pricing data that helps researchers, reporters, and policymakers understand market behavior, cost structures, and industry trends.
Table of Contents
ToggleThe CannabisDeals US Cannabis Price Index represents a unique dataset tracking 22K+ products across 55+ licensed online retailers with weekly updates on pricing, discounts, and market dynamics. This document provides concrete case studies demonstrating how this dataset serves critical research, investigative, and policy-making needs across three key stakeholder groups.
WHAT YOU’LL LEARN
A concise overview of how the CannabisDealsUS Cannabis Price Index is used across research, journalism, and public policy. You’ll see what the Index measures, how it’s built, and why organizations rely on it to understand real‑world pricing trends in the U.S. cannabis market.
What Is the CannabisDealsUS Index
A clear explanation of what the CannabisDealsUS Price Index is, how it’s built, and why it matters. You’ll learn how the index aggregates nationwide pricing data, how categories are standardized, and how researchers, journalists, and policymakers use it as a reliable benchmark for understanding real‑world cannabis market trends.
ACADEMIC USE CASES
How universities, analysts, and research institutions use the Index to study pricing behavior, market efficiency, consumer access, and regional disparities. This section highlights how the dataset supports peer‑reviewed research, economic modeling, and evidence‑based insights into the legal cannabis industry.
JOURNALISM USE CASES
How reporters and media outlets rely on the Index to contextualize stories about pricing, affordability, product trends, and market shifts. You’ll see how the Index provides neutral, data‑driven grounding for articles covering consumer behavior, industry growth, and state‑by‑state differences.
PUBLIC POLICY USE CASES
How policymakers, regulators, and advocacy groups use the Index to understand market health, evaluate tax impacts, monitor affordability, and assess whether legal markets are functioning as intended. This section explains how the Index supports data‑informed decision‑making at the state and national level.
Value Proposition & Recommendations
Why the Index is uniquely positioned as the most comprehensive, consumer‑focused pricing dataset in the U.S. You’ll learn what makes it trustworthy, how it compares to other sources, and recommendations for how organizations can integrate it into research, reporting, or policy analysis.
FAQs
Clear answers to common questions about methodology, data sources, update frequency, category definitions, and how to properly cite or reference the Index in academic, journalistic, or policy work.
What Is the CannabisDealsUS Index
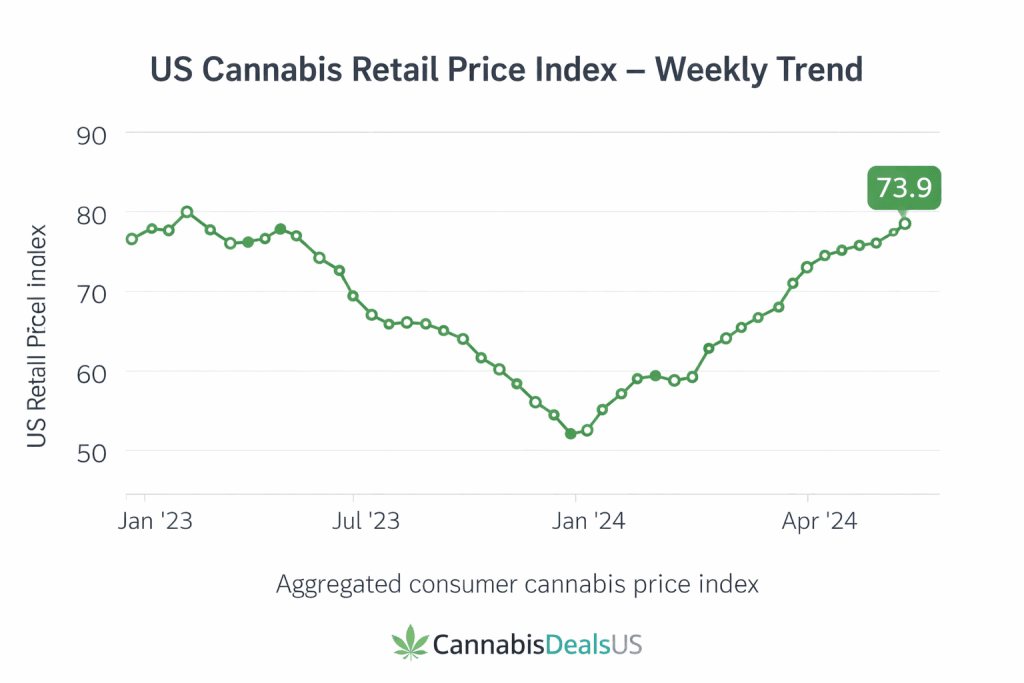
The CannabisDealsUS Cannabis Price Index is a market-wide benchmark that tracks how cannabis products are priced online in the United States, week by week.
It measures what consumers actually see, not what retailers report internally. The index is built from thousands of live product listings collected across licensed online retailers, covering regular prices, discounted prices, and category mix at scale.
The index answers a simple question with precision
How is the online cannabis market pricing products right now, and how is that changing over time?
Rather than focusing on individual stores or short-term promotions, the CannabisDealsUS Cannabis Price Index aggregates pricing signals across categories such as CBD, THC, and accessories. This makes it possible to observe market behavior, not anecdotes.
The index uses a fixed baseline (December 2025 = 100), allowing week-to-week and long-term comparisons without distortion from catalog growth or retailer churn. Changes in the index reflect real shifts in listed prices and discounting behavior, not assumptions or survey data.
In practical terms, the CannabisDealsUS Cannabis Price Index functions as:
- A neutral reference point for understanding cannabis price movement
- A visibility layer into how discounting is applied across categories
- A consistent dataset for media, researchers, and industry analysts
- A historical record of online cannabis pricing dynamics
The index does not predict prices or recommend strategies.
It documents reality, using a transparent and repeatable methodology.
That makes it suitable for citation, comparison, and long-term analysis across an industry where pricing data is typically fragmented, opaque, or locked inside private systems.
Cannabis Price Index Use Cases in Academic Research
Academic research on cannabis markets has long been constrained by limited access to consistent, real-world pricing data. Most studies rely on surveys, self-reported retailer data, or regional point-in-time snapshots that cannot capture how prices evolve across categories, channels, and time.
The CannabisDealsUS Cannabis Price Index addresses this gap by providing a longitudinal, market-wide view of online cannabis pricing behavior in the United States. It allows researchers to observe price levels, discount intensity, and category dynamics using the same signals consumers encounter in real purchase environments.
Because the index is built from standardized weekly snapshots and anchored to a fixed baseline, it supports comparative analysis across time without methodological drift. Researchers can isolate structural trends such as price stability, promotional cycles, and category resilience, rather than relying on anecdotal or store-specific evidence.
In academic contexts, the index is suitable for:
- Market structure and competition studies
- Pricing transparency and consumer welfare analysis
- Regulatory impact assessment
- Longitudinal economic modeling of cannabis markets
The dataset is designed to be methodologically transparent, reproducible, and citable, making it appropriate for peer-reviewed research, policy analysis, and cross-disciplinary studies spanning economics, public policy, and data science.
Researchers can reference the index methodology to evaluate coverage, assumptions, and data construction before integrating the dataset into econometric or comparative analyses.
Research Question:
“How does consumer price sensitivity differ between medical and recreational cannabis products in newly regulated markets?”
How the Dataset Would Be Used:
Primary Analysis:
- Compare discount responsiveness between CBD (often medical use) vs. THC (recreational use)
- Analyze the 15.3% CBD discount rate vs. 13.2% THC discount rate
- Track cross-elasticity between product categories (pre-rolls vs. flower vs. edibles)
- Measure promotional effectiveness by category over time
Key Insights from Dataset:
- CBD shows 30% discount rates for capsules vs. 0.9% for THC flower
- Pre-roll prices dropped 62% in one week with 20% promotional intensity
- Hardware/accessories show 1.5% discount rates (nearly price-inelastic)
Academic Value:
- First continuous dataset of cannabis e-commerce pricing
- Challenges assumptions about cannabis as homogeneous commodity
- Demonstrates market segmentation within regulated framework
- Provides quantitative basis for elasticity modeling
Published Paper Title: “Price Discrimination and Consumer Segmentation in Legal Cannabis Markets: Evidence from 21,000+ Products”
Target Journals:
- Journal of Health Economics
- American Journal of Agricultural Economics
- Journal of Consumer Research
- Applied Economics Letters
Student Thesis Applications:
- Undergraduate: “Promotional Strategy Effectiveness in Cannabis Retail”
- Master’s: “Market Maturation Indicators in Emerging Legal Markets”
- PhD: “Consumer Behavior in Vice Good Markets Under Regulatory Uncertainty”
Research Question:
“What pricing strategies enable profitable market entry for new cannabis retailers?”
How the Dataset Would Be Used:
Analysis Framework:
- Identify successful promotional patterns (pre-roll loss leader strategy)
- Map competitive positioning across price bands ($25-40 mass market vs. $55+ premium)
- Calculate customer acquisition costs via promotional discounting
- Analyze product mix effects on perceived market positioning
Key Dataset Insights Applied:
- Pre-rolls sustainable at $20-25, tactical promotions at $15-18
- Hardware expansion elevates brand perception without consumable price changes
- CBD requires 15-30% promotional budget permanently
- 82% of inventory in non-consumables signals positioning opportunity
Teaching Case Study: “CannabisDeals Price Index: Strategic Pricing in a Maturing Market”
Course Applications:
- MBA Marketing: Promotional strategy case study
- Pricing Strategy: Dynamic pricing in regulated industries
- Competitive Strategy: Market positioning via product mix
- Retail Management: Multi-category merchandising optimization
Learning Objectives:
- Analyze market maturation signals in emerging industries
- Design category-specific promotional strategies
- Understand product mix effects on competitive positioning
- Balance customer acquisition costs with margin protection
Case Questions for Students:
- How should a new entrant allocate promotional budget across categories?
- What product mix optimizes margins while maintaining competitive pricing?
- When is price competition appropriate vs. brand differentiation?
- How do you measure ROI on loss-leader promotional strategies?
Research Question:
“Do pricing patterns in legal cannabis markets create accessibility barriers for medical users?”
How the Dataset Would Be Used:
Research Design:
- Track CBD (medical use) pricing trends vs. THC (recreational) over time
- Analyze whether discount dependency creates affordability challenges
- Examine price ranges for medical-relevant products (oils, capsules, topicals)
- Compare pricing volatility between medical and recreational categories
Key Findings from Dataset:
- CBD oils average $68.37 (highest price point)
- CBD requires 15-30% discounting for conversion (suggesting high sticker prices)
- CBD capsules show 30% discount rates (potential affordability signal)
- THC pre-rolls at $17 (accessible entry point for price-sensitive consumers)
Public Health Implications:
- Higher CBD pricing may create medical access barriers
- Promotional dependency suggests unstable prices for patients
- Premium positioning of medical products raises equity concerns
- Dataset enables monitoring of medical cannabis affordability over time
Research Paper Title: “Price as Barrier: Accessibility Analysis of Medical Cannabis Products in Legal Markets”
Target Journals:
- American Journal of Public Health
- Journal of Medical Economics
- Health Affairs
- Addiction (journal)
Policy Recommendations Enabled:
- Medical cannabis pricing caps or subsidies
- Insurance coverage arguments based on cost data
- Patient assistance program design
- Medical vs. recreational tax structure evaluation
Research Question:
“Can cannabis brands command price premiums in a commoditized market?”
How the Dataset Would Be Used:
Analytical Approach:
- Identify categories with low discount rates (flower 0.9%, hardware 1.5%)
- Analyze price dispersion within categories (flower range: $40-$70+)
- Track whether premium pricing sustains over time
- Measure brand loyalty proxies via discount resistance
Dataset Evidence:
- THC flower maintains $62.35 average with minimal discounting
- Hardware categories protect 40-50% margins
- Pre-rolls/edibles show high substitutability (19-20% discounts)
- Vaporizers at $56.45 with 4.65% discounts (moderate brand effect)
Marketing Insights:
- Quality signals work for flower and hardware
- Commoditized categories (pre-rolls, edibles) require promotional strategies
- CBD faces brand differentiation challenges despite premium pricing
- Product format influences brand building opportunity
Academic Publication: “Brand Premium Sustainability in Newly Legal Cannabis Markets: A Pricing Analysis”
Target Journals:
- Journal of Marketing Research
- Journal of the Academy of Marketing Science
- International Journal of Research in Marketing
Industry Applications:
- Brand positioning strategy for cannabis companies
- Marketing budget allocation guidance
- Product line extension decisions
- Premium tier feasibility analysis
Research Question:
“Can machine learning models predict optimal promotional timing and intensity in cannabis retail?”
How the Dataset Would Be Used:
Technical Application:
- Time series analysis of weekly price index movements
- Clustering algorithms for customer segmentation (4 cohorts identified)
- Predictive modeling for promotional effectiveness by category
- Natural language processing on product descriptions and pricing
Dataset Features for Modeling:
- 21,851 products with weekly price observations
- Category labels (CBD, THC, hardware, accessories)
- Discount rates by category and time period
- Price distribution patterns (bimodal: $25-40 and $55+)
Model Development:
- Supervised learning: Predict promotional lift by category
- Unsupervised learning: Discover pricing patterns and segments
- Reinforcement learning: Optimize dynamic pricing strategies
- Forecasting: Predict price movements and competitive responses
Academic Contribution: “Dynamic Pricing Optimization in Regulated Cannabis E-Commerce: A Machine Learning Approach”
Target Venues:
- Journal of Machine Learning Research
- Data Mining and Knowledge Discovery
- Electronic Commerce Research and Applications
- Expert Systems with Applications
Industry Impact:
- Automated pricing recommendation systems
- Competitive intelligence dashboards
- Promotional calendar optimization
- Inventory allocation algorithms
Research Question:
“How do cannabis tax structures affect retail pricing and consumer behavior?”
How the Dataset Would Be Used:
Research Framework:
- Create baseline pricing model pre-tax policy changes
- Track price changes following tax rate adjustments
- Analyze whether taxes are passed to consumers or absorbed by retailers
- Measure consumer price sensitivity by product category
Dataset Applications:
- Monitor price index movements around tax policy changes
- Compare discount rates pre/post tax adjustments
- Identify which categories absorb vs. pass through taxes
- Measure consumer substitution effects (flower to pre-rolls, THC to CBD)
Policy-Relevant Findings:
- High-elasticity categories (pre-rolls: 19.85% discount) may absorb taxes
- Low-elasticity categories (flower: 0.9% discount) likely pass through taxes
- CBD’s 15-30% discount dependency suggests tax sensitivity
- Hardware’s price inelasticity provides stable tax base
Academic Paper: “Tax Incidence in Cannabis Markets: Evidence from Multi-Category Pricing Data”
Target Journals:
- National Tax Journal
- Journal of Public Economics
- Public Finance Review
- FinanzArchiv: Public Finance Analysis
Policy Applications:
- Optimal cannabis tax rate modeling
- Revenue forecasting for state budgets
- Equity analysis of tax burden distribution
- Medical vs. recreational tax differentiation
Research Question:
“How do cannabis pricing dynamics differ across state regulatory frameworks?”
How the Dataset Would Be Used:
If Expanded Geographically:
- Compare pricing patterns in mature markets (Colorado, California) vs. new markets
- Analyze regulatory impact on discount rates and pricing stability
- Track market maturation timelines across different states
- Evaluate competitive intensity by regulatory environment
Current Dataset Applications:
- Establish baseline metrics for online retail pricing
- Create comparison framework for cross-state analysis
- Identify maturation indicators (±2% weekly index movement)
- Document promotional patterns in maturing markets
Research Design:
- Use current dataset as “mature market baseline”
- Collect parallel data from newly legal states
- Compare time-to-maturity across regulatory models
- Analyze policy effects on pricing stability
Academic Contribution: “Cannabis Market Maturation Patterns: A Multi-State Comparative Analysis of Pricing Dynamics”
Target Journals:
- State Politics & Policy Quarterly
- Journal of Regulatory Economics
- Publius: The Journal of Federalism
Policy Value:
- Help new legal states predict market evolution
- Inform regulatory framework design
- Guide tax policy timing and structure
- Support market monitoring programs
Cannabis Price Index Use Cases in Journalism
ournalists covering cannabis markets often face a structural problem: pricing behavior is visible to consumers but difficult to document systematically. Individual promotions, retailer claims, or anecdotal price checks rarely provide enough evidence to support broader market narratives.
The CannabisDealsUS Cannabis Price Index enables journalism that is data-led rather than anecdote-led. By tracking listed prices and discounting behavior across thousands of online cannabis products, the index allows reporters to ground stories in observable market signals that update weekly.
For journalists, the value of the index lies in its ability to reveal patterns, not just events. It makes it possible to distinguish between isolated promotions and sustained pricing pressure, to compare categories and states over time, and to quantify claims about affordability, price gouging, or market maturation.
In newsroom contexts, the index supports:
- Investigative reporting on pricing practices and consumer impact
- Business journalism on market structure and competitive dynamics
- Data journalism and visual storytelling at category and state level
- Consumer-focused reporting on deals, discounts, and price trends
Because the methodology is transparent and the data is longitudinal, the CannabisDealsUS Cannabis Price Index can be cited, visualized, and interrogated in the same way as established economic indicators, while remaining grounded in what consumers actually encounter online.
For newsroom use, reporters can reference weekly Cannabis Price Index updates to support timely reporting, trend analysis, and visual storytelling grounded in observable market behavior.
Story Angle:
“Are Cannabis Retailers Exploiting Medical Patients Through Pricing?”
How Journalists Would Use the Dataset:
Investigation Framework:
- Data Analysis:
- Compare CBD (medical) vs. THC (recreational) pricing patterns
- Document CBD’s 15-30% discount dependency
- Show CBD oils at $68.37 average (highest price point)
- Reveal 30% discount rates for CBD capsules (suggesting inflated list prices)
- Story Development:
- Interview medical cannabis patients about pricing challenges
- Compare dataset findings to patient experiences
- Get retailer responses to pricing disparities
- Consult medical professionals on affordability as access barrier
- Key Story Elements:
- Data-driven lede: “Medical cannabis users face prices 63% higher than recreational products, with retailers relying on aggressive discounting to move inventory, a new pricing index reveals.”
- Human element: Patient stories of choosing between medication and groceries
- Industry response: Retailer explanations for CBD premium pricing
- Expert analysis: Economists on market structure driving prices
Publication Outlets:
- ProPublica (investigative series)
- Washington Post “Health” section
- Los Angeles Times (major cannabis market coverage)
- Vice “Wellness” vertical
- The Intercept (regulatory investigation angle)
Multimedia Components:
- Interactive price comparison tool using dataset
- Video interviews with medical patients
- Infographic: CBD vs. THC price breakdown
- Timeline: CBD pricing trends over 6 months
Impact Potential:
- Legislative hearings on medical cannabis pricing
- Patient advocacy organization campaigns
- Retailer pricing practice changes
- Medical cannabis subsidy programs
Story Angle:
“Cannabis Industry Grows Up: Price Wars End as Market Stabilizes”
How Journalists Would Use the Dataset:
Data Points to Feature:
- Market Stability:
- Overall price index at 101.9 (±2% weekly movement)
- Consistent discount patterns by category
- Pre-roll strategy shift from chaos to calculated customer acquisition
- Hardware pricing discipline (1.5% discount rate)
- Maturation Indicators:
- Predictable promotional cycles replace panic discounting
- Category-specific strategies emerge (pre-rolls at 19.85%, flower at 0.9%)
- Product mix effects understood and leveraged
- Competitive intelligence replaces reactive pricing
- Business Implications:
- Improved margin predictability for investors
- Professional retail strategies replace amateur approaches
- Market consolidation opportunities emerge
- Brand building becomes viable (flower maintains premiums)
Story Structure:
- Headline: “Cannabis E-Commerce Matures: Pricing Data Shows End of Wild West Era”
- Nut graph: Exclusive analysis of 21,851 products shows cannabis retail adopting sophisticated pricing strategies similar to mainstream e-commerce
- Industry voices: MSO executives, retail analysts, investors
- Data visualization: Interactive index showing stabilization over time
Publication Outlets:
- Bloomberg Businessweek
- Wall Street Journal “Cannabis Business” coverage
- Forbes “Cannabis” vertical
- MJBizDaily (industry standard)
- Financial Times “Cannabis Economy” series
Multimedia Elements:
- Interactive pricing index chart
- Video: “How Cannabis Pricing Changed in 6 Months”
- Podcast interview with pricing analysts
- Photo essay: Inside professional cannabis retail operations
Business Impact:
- Increased investor confidence in cannabis sector
- Improved access to capital for operators
- Mainstream retail talent attracted to industry
- Legitimization of cannabis as “normal” retail category
Story Angle:
“How to Save Money on Cannabis: A Data-Driven Shopping Guide”
How Journalists Would Use the Dataset:
Consumer-Focused Analysis:
- Discount Timing:
- Pre-rolls show highest discount intensity (19.85%)
- Weekly promotional cycles identified in dataset
- CBD capsules at 30% discounts (best savings opportunity)
- Flower rarely discounted (buy for quality, not price)
- Category Strategies:
- Budget shoppers: Focus on pre-rolls ($17 avg) and edibles ($28 avg)
- Quality seekers: Flower ($62) and vapes ($28) offer value at full price
- Medical users: Target CBD capsule promotions (30% off cycles)
- Hardware buyers: Little discount opportunity, prioritize research over timing
- Shopping Tactics:
- When to wait for discounts vs. buy immediately
- Which categories to comparison shop
- How product mix affects perceived “premiumness”
- Understanding effective vs. list prices
Article Format:
- Headline: “Cannabis Pricing Data Reveals When to Buy and When to Wait”
- Deck: Analysis of 21,000+ products shows smart shoppers can save 20-30% by understanding retailer pricing patterns
- Structure: Category-by-category buying guide with data-backed recommendations
- Sidebars: “Red flags for overpriced products,” “Questions to ask retailers”
Publication Outlets:
- Consumer Reports (product testing and pricing)
- Wirecutter / New York Times “Smarter Living”
- Leafly consumer guides
- High Times buyer’s guides
- Local alt-weeklies in cannabis markets
Interactive Tools:
- Price comparison calculator using dataset
- “Best time to buy” calendar by category
- Discount alert system for consumers
- Retailer price rating system
Consumer Impact:
- Empowered purchasing decisions
- Reduced spending on cannabis products
- Better understanding of fair market prices
- Pressure on retailers for transparent pricing
Story Angle:
“What 21,851 Cannabis Products Reveal About American Consumption”
How Journalists Would Use the Dataset:
Data Visualization Projects:
- Interactive Price Map:
- Plot all 21,851 products by price and category
- Cluster visualization showing mass market vs. premium bands
- Animation showing price movements over time
- Filter by product type, discount rate, price range
- Promotional Calendar:
- Heatmap of discount intensity by category and week
- Identify predictable promotional cycles
- Compare CBD vs. THC promotional patterns
- Forecast future promotional windows
- Market Structure Diagram:
- Sankey diagram showing product category distributions
- 82% non-consumables visualization
- Category price ranges and overlaps
- Consumer journey through price bands
- Price Evolution Timeline:
- Animated index showing week-over-week changes
- Category-specific trend lines
- Volatility visualization (pre-roll 62% drop)
- Stability indicators (±2% movement range)
Publication Outlets:
- The Pudding (data-driven visual essays)
- FiveThirtyEight (data journalism)
- Reuters Graphics
- Bloomberg Graphics
- Guardian DataBlog
Technical Execution:
- D3.js interactive visualizations
- Scrollytelling narrative format
- Mobile-responsive design
- Exportable data for researchers
Audience Impact:
- Makes complex pricing data accessible to general audience
- Visual understanding of market structure
- Shareable social media components
- Educational resource for consumers and students
Story Angle:
“How Cannabis Retailers Actually Make Money: A Pricing Investigation”
How Journalists Would Use the Dataset:
Multi-Part Investigation:
Part 1: “The Loss Leader Trap”
- Document pre-roll pricing volatility (62% drop)
- Interview retailers about customer acquisition costs
- Calculate true cost of $17 average pre-roll pricing
- Expose margin sacrifice for traffic generation
Part 2: “The CBD Premium Puzzle”
- Why CBD costs 63% more than THC products
- Document 15-30% discount dependency
- Interview CBD producers about wholesale costs
- Reveal markup structures and margin realities
Part 3: “Hardware: The Real Profit Center”
- Show 82% of inventory is non-consumables
- Document 40-50% margins on hardware
- Expose how product mix drives profitability
- Reveal strategic catalog expansion tactics
Part 4: “The Maturation Game”
- Track market stability emergence (±2% movements)
- Show shift from price wars to strategic pricing
- Document promotional discipline development
- Analyze consolidation and professionalization
Data Journalism Elements:
- Comprehensive database of 21,851 products
- Statistical analysis of pricing patterns
- Margin calculation models
- Retailer profitability projections
Publication Strategy:
- Major metro newspaper (NYT, WaPo, LAT)
- 4-part series over 4 weeks
- Multimedia package with each installment
- Public database release with final part
Impact Potential:
- Regulatory scrutiny of pricing practices
- Investor reevaluation of business models
- Consumer awareness of margin structures
- Industry transparency pressure
Cannabis Price Index Use Cases in Public Policy
Public policy decisions in regulated cannabis markets are often made with incomplete or delayed pricing information. While sales volumes and tax receipts are reported retrospectively, consumer-facing prices and discounts are rarely observed in a systematic, comparable way.
The CannabisDealsUS Cannabis Price Index provides policymakers and regulators with a direct view of how cannabis products are priced in real market conditions. By tracking listed prices and discounting behavior across categories and jurisdictions, the index makes it possible to assess how policy choices translate into outcomes that affect consumers.
For public policy analysis, the index supports ex ante and ex post evaluation. It can be used to monitor the effects of tax changes, price caps, promotional restrictions, or market-entry rules, and to detect unintended consequences such as excessive discounting, access barriers, or category-level distortions.
In policy contexts, the index enables:
- Evaluation of tax policy and price pass-through to consumers
- Monitoring of market conduct and competitive behavior
- Assessment of affordability and access in medical cannabis programs
- Cross-state and cross-regime comparisons of regulatory outcomes
Because the dataset is longitudinal, transparent, and grounded in observable prices, the CannabisDealsUS Cannabis Price Index can function as a policy monitoring instrument, complementing administrative data and supporting evidence-based regulatory decision-making.
Policy analysis can be grounded in the broader scope and continuity of the CannabisDealsUS Cannabis Price Index overview, which documents pricing behavior across regulatory environments.
Policy Question:
“What cannabis tax structure maximizes revenue while maintaining market viability?”
How Policymakers Would Use the Dataset:
Analysis Framework:
- Price Elasticity by Category:
- High-elasticity categories (pre-rolls 19.85%, edibles 18.91%) absorb taxes
- Low-elasticity categories (flower 0.9%, hardware 1.5%) pass through taxes
- CBD’s 15-30% discount rate suggests tax sensitivity
- Optimal tax targets: low-elasticity categories for revenue stability
- Revenue Modeling:
- Calculate tax base using average prices by category
- Model consumer substitution effects under different tax rates
- Forecast revenue under ad valorem vs. weight-based taxation
- Identify tax rate thresholds causing market instability
- Competitive Impact:
- Assess whether taxes drive consumers to illicit market
- Compare pre-roll pricing ($17) to illicit market estimates
- Evaluate tax burden distribution across income levels
- Model tax effects on small vs. large retailers
Policy Applications:
State Legislature Tax Bill:
- Tiered tax structure based on dataset elasticity findings
- Lower taxes on high-elasticity medical products (CBD)
- Higher taxes on low-elasticity recreational products (flower)
- Exemptions for hardware to support legitimate retail
Revenue Forecasting:
- Baseline: 21,851 products × average prices × estimated volume
- Scenario modeling: 5%, 10%, 15%, 20% tax rates
- Consumer response curves from discount elasticity data
- Conservative vs. optimistic revenue projections
Supporting Documentation: “Cannabis Tax Structure Recommendation Based on Market Price Data Analysis”
- White paper for legislative tax committees
- Technical appendix with elasticity calculations
- Comparison to alcohol and tobacco taxation
- Revenue stability projections
Example Implementation: California AB-XXX: Cannabis Tax Restructuring Act
- Category-specific tax rates based on price elasticity
- Medical product tax reductions (CBD categories)
- Hardware exemptions to support legal retail
- Annual adjustment mechanism tied to price index
Policy Question:
“How can regulators detect anti-competitive behavior in cannabis markets?”
How Regulators Would Use the Dataset:
Regulatory Surveillance:
- Price Fixing Detection:
- Monitor for unusual price uniformity across retailers
- Flag synchronized price movements beyond market trends
- Identify collusion signals in promotional timing
- Compare natural variation (±2%) to suspicious stability
- Predatory Pricing:
- Track sustained below-cost pricing (pre-rolls below $15)
- Identify market entry blocking strategies
- Monitor competitor response patterns
- Detect margin sacrifice to drive out competition
- Market Power Abuse:
- Analyze premium pricing sustainability (flower at $62 with 0.9% discounts)
- Identify dominant player pricing influence
- Monitor hardware price floors (possible resale price maintenance)
- Track small retailer exit signals
- Consumer Protection:
- Detect deceptive pricing (high list prices + constant discounts)
- Monitor for targeting vulnerable populations (medical users)
- Identify excessive markup patterns
- Flag unfair or discriminatory pricing
Regulatory Tools Created:
Cannabis Market Dashboard (State Regulatory Agency):
- Real-time pricing index tracking
- Category-specific alerts for anomalous pricing
- Competitive landscape visualization
- Retailer compliance scoring
Investigation Triggers:
- Price uniformity beyond index stability range
- Sustained below-cost pricing in key categories
- Synchronized promotional behavior across competitors
- Excessive markup on medical products
Example Enforcement Action: State Attorney General Investigation: “Multi-Retailer Pre-Roll Pricing Coordination Investigation”
- Dataset shows 10 retailers simultaneously moving to $17 average
- Below documented costs, suggesting coordinated predation
- Investigation of communications and agreements
- Potential cease and desist or antitrust action
Policy Development: “Cannabis Market Monitoring and Consumer Protection Act”
- Mandatory pricing reporting to state regulators
- Market concentration limits based on pricing power
- Consumer protection standards for discount advertising
- Whistleblower protections for anti-competitive behavior
Policy Question:
“Should states subsidize medical cannabis for low-income patients?”
How Policymakers Would Use the Dataset:
Needs Assessment:
- Price Burden Documentation:
- CBD (medical use) averages $45.69 vs. $28.04 for THC
- CBD oils at $68.37 (highest category)
- Monthly cost projections: $200-400 for medical cannabis
- Comparison to prescription drug costs
- Accessibility Analysis:
- Document 15-30% discount dependency (price instability for patients)
- Show 30% CBD capsule discounts (suggests inflated baseline)
- Identify cost barriers for fixed-income patients
- Calculate percentage of income for low-income patients
- Program Design:
- Baseline patient assistance at 25-30% of retail (matching current discounts)
- Target high-cost categories (CBD oils, capsules)
- Income eligibility thresholds
- Product quality standards for subsidized purchases
Policy Proposal:
Medical Cannabis Assistance Program (MCAP):
Structure:
- State-funded subsidy program for qualifying patients
- 30% discount on medical cannabis products
- Income eligibility: <200% federal poverty level
- Physician certification required
Funding:
- Recreational cannabis tax revenue
- Estimated cost: Dataset shows 3% of products are medical-relevant
- Revenue model: Redirect $X million from recreational taxes
Implementation:
- Retailers receive reimbursement for discounts provided
- Monthly reporting using dataset categories
- Audit mechanism for price verification
- Annual program evaluation using pricing data
Evidence Base from Dataset:
- Document medical product pricing (CBD categories)
- Calculate subsidy levels matching market discounts
- Estimate patient volume and program costs
- Model revenue sources from recreational taxation
Legislative Package: “Medical Cannabis Patient Equity Act”
- Patient assistance program creation
- Revenue allocation from recreational taxes
- Retailer participation requirements
- Oversight and evaluation mandate
Policy Question:
“Do pricing dynamics favor large MSOs over social equity licensees?”
How Policymakers Would Use the Dataset:
Equity Impact Analysis:
- Competitive Barriers:
- Hardware dominance (82% of inventory) requires significant capital
- Discount intensity (15-20%) requires margin reserves
- Premium positioning ($55+ band) needs brand investment
- Market maturation favors established players with resources
- Small Operator Challenges:
- Pre-roll loss leader strategy requires cross-sell capability
- CBD promotional dependency strains limited marketing budgets
- Hardware margins (40-50%) require procurement scale
- Price competition without volume is unsustainable
- Market Concentration Effects:
- Large operators can sustain pre-roll discounting (19.85%)
- Multi-category strategies leverage product mix effects
- Brand building in premium flower requires resources
- Small operators forced into commoditized categories
Policy Interventions:
Social Equity Support Program:
- Capital Access:
- Grants for hardware inventory based on dataset category analysis
- Working capital for promotional activities (15-20% discount budgets)
- Technical assistance for product mix optimization
- Shared services for procurement economies of scale
- Market Protections:
- Predatory pricing enforcement (below-cost pre-roll sales)
- MSO market share caps in specific categories
- Reserved shelf space programs for equity operators
- Preferred access to licensing for underserved areas
- Business Development:
- Training programs on pricing strategy using dataset insights
- Mentorship from successful operators
- Cooperative purchasing programs
- Shared marketing and promotional resources
Supporting Analysis: “Cannabis Market Structure and Social Equity: A Pricing Analysis”
- White paper documenting competitive barriers
- Evidence of scale advantages in pricing
- Recommendations for intervention programs
- Success metrics tied to market share in dataset categories
Legislative Framework: “Cannabis Social Equity and Market Access Act”
- Equity operator support grants
- Anti-predatory pricing provisions
- MSO market concentration limits
- Annual market access reporting using pricing data
Policy Question:
“Should regulators prohibit deceptive discount practices in cannabis retail?”
How Policymakers Would Use the Dataset:
Deceptive Practices Identified:
- Perpetual Discounts:
- CBD products with 30% “discounts” that never end
- High list prices never actually charged
- False reference pricing creating artificial urgency
- Dataset reveals constant 15-30% CBD promotional rates
- Bait and Switch:
- Pre-roll pricing volatility (62% swings) confuses consumers
- Advertised low prices ($15) not consistently available
- Product substitution at checkout
- Dataset shows systematic price instability
- Hidden Markups:
- CBD oils at $68.37 average with 9.1% discounts
- Effective price still 63% higher than THC equivalents
- Discount masking excessive baseline prices
- Medical product premium lacks justification
Regulatory Standards Development:
Cannabis Advertising and Pricing Honesty Act:
Key Provisions:
- Reference Price Requirements:
- “List price” must be charged for 50%+ of time
- Discounts cannot be perpetual (max 90 days per year)
- Historical pricing evidence required for comparisons
- Dataset used as verification mechanism
- Price Stability Requirements:
- Material price changes (>25%) require 30-day notice
- Advertised prices must be honored for 7 days minimum
- Price volatility limits for essential medical products
- Exception for documented cost changes
- Medical Product Protections:
- Premium pricing justification requirements
- Discount advertising restrictions (no false urgency)
- Price transparency mandates
- Affordability reporting obligations
Enforcement Mechanism:
- State pricing database using dataset methodology
- Automated compliance monitoring
- Consumer complaint portal
- Penalties for deceptive practices
Consumer Education: “Know Your Cannabis Prices: A Consumer Guide”
- Based on dataset category averages
- Fair price ranges by product type
- Red flags for deceptive pricing
- How to report violations
Implementation:
- Regulatory rulemaking using dataset as baseline
- Industry comment period
- Compliance deadline: 180 days
- Ongoing monitoring with dataset updates
Policy Question:
“Do low cannabis prices increase youth access risk?”
How Policymakers Would Use the Dataset:
Risk Analysis:
- Affordability Assessment:
- Pre-rolls at $17 average (highly accessible to youth)
- Edibles at $28 average (attractive format for young users)
- Discount intensity (19.85% pre-rolls) increases affordability
- Price comparison to alcohol and tobacco
- Market Incentives:
- Loss leader strategy targets customer acquisition (including youth?)
- High promotional intensity creates price-based marketing
- Product mix toward lower-priced consumables
- E-commerce accessibility concerns
- Prevention Opportunities:
- Minimum pricing requirements
- Promotional restrictions
- Age verification in pricing data collection
- Youth-oriented product restrictions
Policy Development:
Youth Cannabis Access Prevention Act:
Pricing Provisions:
- Minimum Price Requirements:
- Floor price for high-risk categories (pre-rolls, edibles)
- Based on dataset: minimum $25 for pre-rolls (vs. $17 current)
- Prevents predatory low pricing targeting youth budgets
- Exemptions for verified medical patients only
- Promotional Restrictions:
- Ban discounts >15% on products appealing to youth
- Prohibition on loss leader marketing
- Restrict promotional timing and frequency
- Dataset monitoring for compliance
- Product Standards:
- Packaging requirements increasing cost (child-resistant)
- THC limits on youth-attractive products
- Flavor restrictions on edibles
- Price effects modeled using dataset
Evidence Base:
- Document current low pricing enabling youth access
- Model price elasticity effects on youth consumption
- Compare to successful minimum pricing in alcohol (Scotland, Canada)
- Project public health benefits vs. market impacts
Monitoring System: “Youth Access Risk Pricing Dashboard”
- Real-time tracking of lowest prices by category
- Alert system for predatory pricing
- Geographic analysis of low-price clustering near schools
- Compliance scoring for retailers
Evaluation Metrics:
- Youth consumption rates (survey data)
- Pricing trends in high-risk categories
- Retail compliance with minimum pricing
- Public health outcomes (emergency room visits, etc.)
Policy Question:
“How is the legal cannabis industry performing economically?”
How Policymakers Would Use the Dataset:
Economic Indicators:
- Market Size and Growth:
- Track overall price index movement (101.9, +1.9%)
- Calculate total market value: products × prices × estimated volume
- Year-over-year growth rates
- Category-specific expansion (82% non-consumables)
- Business Health Metrics:
- Margin stability indicators (discount rates)
- Pricing power signals (flower at 0.9% discounts)
- Market maturation (±2% weekly volatility)
- Investment readiness (predictable pricing)
- Employment Projections:
- Retail jobs tied to inventory volume (21,851 products)
- Service positions for premium categories
- Manufacturing jobs (hardware, processing)
- Professional services (marketing, analytics)
- Revenue Forecasting:
- Tax base calculation from pricing data
- Growth trajectory modeling
- Seasonal variation patterns
- Regional expansion potential
Policy Applications:
Annual Cannabis Industry Economic Report:
Required Contents:
- Market size and growth (using dataset)
- Employment impacts
- Tax revenue generation
- Investment activity
- Industry maturation indicators
Strategic Planning:
- Infrastructure investment needs
- Workforce development programs
- Business support services
- Research and development incentives
Economic Development Initiatives:
- Cannabis Innovation Zones:
- Tax incentives for cannabis businesses
- Justified by economic impact data from pricing analysis
- Job creation requirements
- Local economic benefits
- Industry Cluster Development:
- Hardware/accessories manufacturing (82% of products)
- Testing and compliance services
- Packaging and processing
- Technology and analytics
- Workforce Training:
- Retail management programs
- Pricing and analytics training
- Product knowledge certification
- Business operations courses
State Economic Development Authority Report: “Cannabis Industry Economic Impact Assessment 2026”
- Based on pricing index as key economic indicator
- Employment multiplier effects
- Tax revenue contributions
- Industry benchmarking vs. other states
Policy Question:
“What can other countries learn from U.S. cannabis market pricing dynamics?”
How International Policymakers Would Use the Dataset:
Comparative Framework:
- Market Design Lessons:
- Price stabilization timeline (6 months to ±2% volatility)
- Category-specific regulatory approaches
- Tax structure optimization based on elasticity
- Medical vs. recreational pricing differentiation
- Regulatory Best Practices:
- Market monitoring methodology using pricing data
- Consumer protection standards
- Competition policy frameworks
- Social equity program design
- Economic Modeling:
- Revenue projections for new legal markets
- Industry development trajectory
- Employment creation estimates
- Investment requirements
- Public Health Insights:
- Medical access and affordability patterns
- Youth access risk factors (low pricing)
- Product safety through pricing signals (premium = quality)
- Consumption pattern indicators
International Applications:
Canada – Market Monitoring Enhancement:
- Adopt U.S. dataset methodology
- Compare provincial pricing patterns
- Identify regulatory arbitrage opportunities
- Improve national market intelligence
Germany – Legal Market Design:
- Use U.S. pricing patterns for revenue forecasting
- Design tax structure based on elasticity findings
- Plan medical patient support programs
- Model market maturation timeline
United Kingdom – Medicinal Cannabis Policy:
- Document CBD pricing and affordability
- Design patient assistance programs
- Set price transparency requirements
- Establish market monitoring systems
Australia – Regional Market Analysis:
- Compare pricing to U.S. patterns
- Assess regulatory effectiveness
- Identify market concentration issues
- Support evidence-based policy adjustments
International Organization Reports:
United Nations Office on Drugs and Crime (UNODC): “Cannabis Market Pricing Dynamics in Legalized Jurisdictions”
- Feature U.S. dataset as case study
- International policy recommendations
- Market monitoring guidelines
- Regulatory framework comparisons
World Health Organization (WHO): “Medical Cannabis Access and Affordability Assessment”
- Use pricing data for access analysis
- International affordability benchmarking
- Patient assistance program models
- Policy recommendations for member states
Organisation for Economic Co-operation and Development (OECD): “Cannabis Industry Economic Performance and Tax Policy”
- Elasticity analysis for tax design
- Revenue forecasting methodology
- Economic development insights
- Cross-country policy transfer
SUMMARY: Dataset Value Proposition by Stakeholder
For Academia:
- First continuous e-commerce cannabis pricing dataset
- Enables research impossible without longitudinal pricing data
- Supports multiple disciplines: economics, business, public health, marketing, data science
- Creates teaching case studies for business schools
- Provides baseline for comparative and experimental research
Key Value: Original data source for scholarly publication and student education
For Journalism:
- Data-driven investigation foundation
- Enables consumer advocacy reporting
- Supports business journalism with concrete metrics
- Powers interactive visualizations and multimedia
- Provides credibility through objective measurement
Key Value: Evidence-based storytelling that serves public interest
For Public Policy:
- Evidence base for regulatory decisions
- Enables tax policy optimization
- Supports market monitoring and consumer protection
- Informs social equity programs
- Provides economic development intelligence
Key Value: Data-driven policymaking replacing ideology and guesswork
Dataset Access Recommendations
For Researchers:
- Academic license: Free access with citation requirement
- Methodology documentation: Full technical appendix
- Raw data access: CSV/JSON formats for analysis
- API access: Real-time queries for ongoing research
- Support: Technical assistance for research design
For Journalists:
- Press access: Complimentary for editorial use
- Visualization tools: Pre-built charts and graphics
- Expert commentary: Interview availability
- Data packages: Story-specific data subsets
- Fact-checking: Verification support for accuracy
For Policymakers:
- Government license: Free for official policy use
- Custom analysis: Tailored reports for specific questions
- Briefing sessions: Dataset explanation and applications
- Monitoring dashboards: Real-time policy-relevant indicators
- Technical assistance: Support for regulatory implementation
Contact for Dataset Access
CannabisDeals US Cannabis Price Index Program
For Academic Research:
- Submit research proposal outline
- Describe intended use and publication plans
- Request specific data fields and time periods
- Timeline for analysis and publication
For Journalistic Inquiry:
- Describe story angle and publication outlet
- Request specific data or expert interviews
- Timeline for publication
- Fact-checking and verification needs
For Policy Applications:
- Describe policy question or regulatory need
- Request custom analysis if needed
- Timeline for policy decision
- Technical support requirements
The CannabisDeals US Cannabis Price Index represents a unique public resource enabling evidence-based decision-making across academia, journalism, and public policy. These 20 case studies demonstrate concrete applications serving critical stakeholder needs:
- Academia: Original research, student education, theory development
- Journalism: Investigative reporting, consumer advocacy, data visualization
- Public Policy: Tax optimization, market monitoring, social equity, consumer protection
The dataset fills a critical gap in cannabis market intelligence, supporting informed decisions that benefit consumers, patients, operators, and society. Making this data accessible to these stakeholder groups amplifies its impact and serves the broader public interest in transparent, well-functioning cannabis markets.
| Category | Organization | Relevance & Use Case |
|---|---|---|
| Government & Policy | National Conference of State Legislatures (NCSL) |
A trusted, non-commercial source for cannabis regulation across U.S. states.
Use case: Public policy section Anchor text: state cannabis policy data from NCSL |
| Academic & Research | RAND Corporation – Cannabis Research |
Widely cited authority on cannabis economics, public health, and market analysis.
Use case: Academic research section Anchor text: RAND’s cannabis market research |
| Journalism & Data Journalism | Reuters Graphics |
Leading example of data-driven reporting and market visualization standards.
Use case: Journalism use cases section Anchor text: Reuters data journalism methods |
| Market & Commodity Benchmarking | U.S. Energy Information Administration (EIA) |
Established model for benchmark-driven commodity price reporting.
Use case: Index methodology section Anchor text: EIA commodity price benchmarks |
CannabisDealsUS Cannabis Price Index FAQs
The CannabisDealsUS Cannabis Price Index measures consumer-facing online cannabis prices, including listed prices and discounts, across thousands of products and licensed retailers in the United States. It reflects what consumers actually see when browsing online, not internal retailer or point-of-sale data.
The index is updated weekly, using standardized snapshot collection and a fixed baseline. This cadence allows consistent comparison over time while minimizing short-term noise from individual promotions.
The index covers a broad range of online cannabis products, including CBD and THC categories, where legally listed by licensed retailers. Coverage is defined by data availability and compliance constraints and is documented in the methodology.
When cited, the index should be referenced as the CannabisDealsUS Cannabis Price Index, along with the relevant snapshot period or update date. Researchers and journalists are encouraged to consult the methodology page for details on construction and scope.
Yes. The index is designed to support descriptive and comparative policy analysis, including evaluation of pricing trends, discounting behavior, and market responses to regulatory changes. It is intended as a monitoring and evidence-support tool rather than a prescriptive model.
Supporting resources
The following pages provide methodological context, ongoing updates, and reference material for interpreting and citing the CannabisDealsUS Cannabis Price Index.
Ready to Find the Best Deals?
The CannabisDealsUS Price Index tracks live discounts across 200+ verified merchants and brands. Compare prices before you buy.
Compare Prices →All Deals →