The CannabisDealsUS Cannabis Price Index tracked 43,915 online cannabis products this week, with the market average settling at $57.50 per product and average discounting at 1.8%. Prices remain 3.87% below the December 2025 baseline. The composite index eased 0.03 points week-on-week to 103.87. CBD Creams declined 0.5% week-on-week to $43.42.
This Week at a Glance
| $57.50 | 1.8% | 43,915 | 103.87 |
|---|---|---|---|
| Average Effective Price | Average Discount | Products Tracked | Index Value |
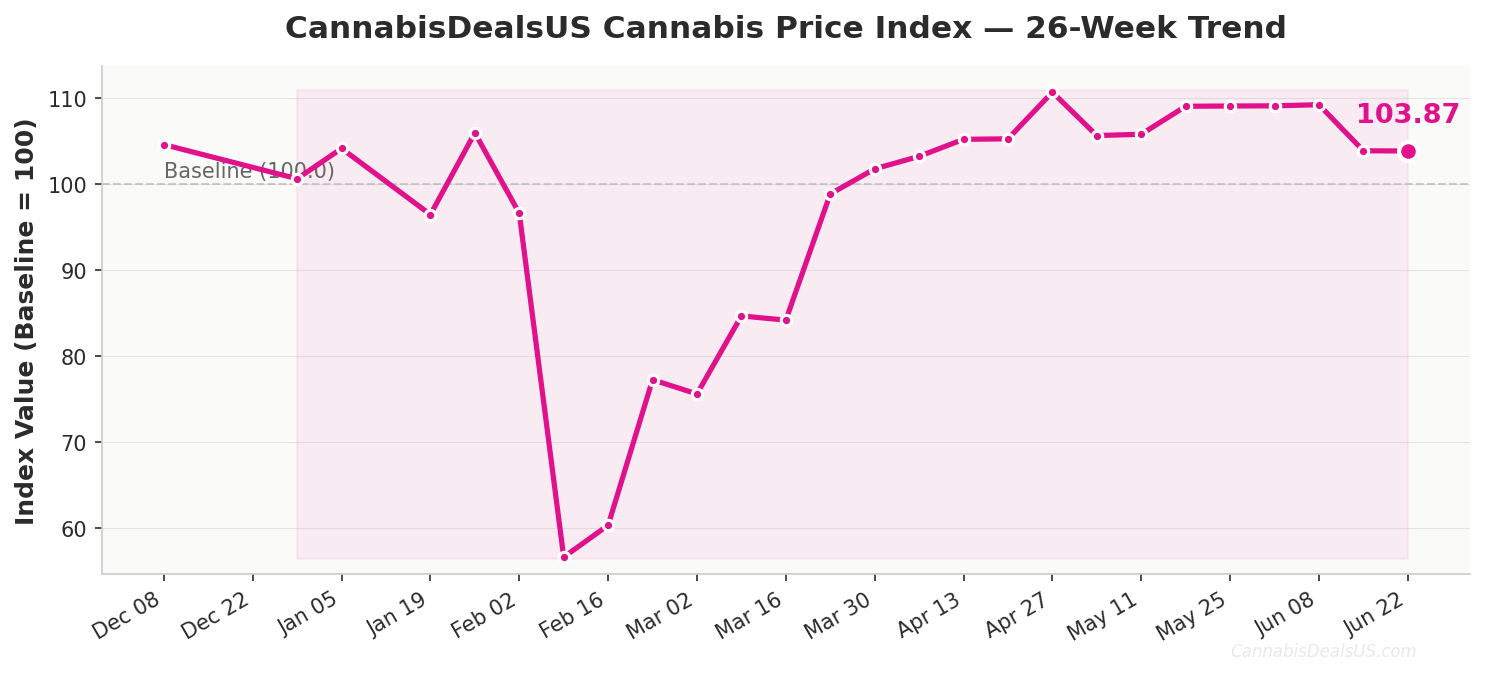
14-Week Index Trend
| Week | Index (Base = 100) | Avg Price |
|---|---|---|
| Dec 8 | 104.62 | $57.91 |
| Dec 29 | 100.64 | $55.71 |
| Jan 5 | 104.17 | $57.67 |
| Jan 19 | 96.47 | $53.40 |
| Jan 26 | 105.99 | $58.68 |
| Feb 2 | 96.62 | $53.48 |
| Feb 9 | 56.59 | $31.33 |
| Feb 16 | 60.30 | $33.38 |
| Feb 23 | 77.24 | $42.76 |
| Mar 2 | 75.59 | $41.84 |
| Mar 9 | 84.67 | $46.87 |
| Mar 16 | 84.18 | $46.60 |
| Mar 23 | 98.87 | $54.73 |
| Mar 30 | 101.79 | $56.35 |
| Apr 6 | 103.25 | $57.16 |
| Apr 13 | 105.23 | $58.25 |
| Apr 20 | 105.29 | $58.29 |
| Apr 27 | 110.72 | $61.29 |
| May 4 | 105.67 | $58.50 |
| May 11 | 105.82 | $58.58 |
| May 18 | 109.08 | $60.39 |
| May 25 | 109.11 | $60.40 |
| Jun 1 | 109.13 | $60.41 |
| Jun 8 | 109.26 | $60.48 |
| Jun 15 | 103.90 | $57.51 |
| Jun 22 | 103.87 | $57.50 |
Since the Dec 8 baseline of 100.00, the index has traded in a range of 56.59 to 110.72 across 25 post-baseline readings. The current reading of 103.87 sits 6.85 points below the series high of 110.72. Market-wide effective prices remain 3.87% below the baseline average of $55.36.
Quote-Ready Insights
“The CannabisDealsUS Cannabis Price Index eased 0.03 points week-on-week to 103.87 for the week of Jun 22, with the market average at $57.50 across 43,915 tracked products.”
“CBD Creams declined 0.5% week-on-week to $43.42, across 262 tracked products.”
“Consumables remain the most discounted segment, with deeper cuts in edibles and vapes than in hardware categories.”
Access deeper data cuts and full dataset.
Market Insights
CBD Pricing
CBD Oil averages $77.24–$85.38 per product. CBD For Pets and CBD Capsules carry the heaviest promotions (16% avg discount rate). Limited WoW variance since baseline.
THC Pricing
23.9% of THC Capsules carry active discounts. THC Capsules lowest at $16.69 avg. THC Vape tracks 3,270 SKUs at $34.63 avg.
Discount Patterns
Discount rate: 5.3% of SKUs carry active promotions. Depth averages ~34% on discounted SKUs. THC Capsules heaviest discounted. THC Flower lightest.
Market Signals
Composite index holds 56.59–110.72 range over 25 weeks. Equilibrium ~4% above Dec 2025. Promotional activity contracting.
CBD & THC Market Snapshot
| Segment | Avg Price | WoW | Avg Discount | SKUs Tracked |
|---|---|---|---|---|
| Overall | $57.50 | -0.0% | 1.8% | 43,915 |
| CBD | $62.83 | -0.2% | 6.1% | 3,131 |
| THC | $36.48 | -0.1% | 7.3% | 6,700 |
| Other | $61.50 | 0% | 0.4% | 37,579 |
CBD Subcategories
| Category | Avg Price | WoW Price Change | Avg Discount | SKUs |
|---|---|---|---|---|
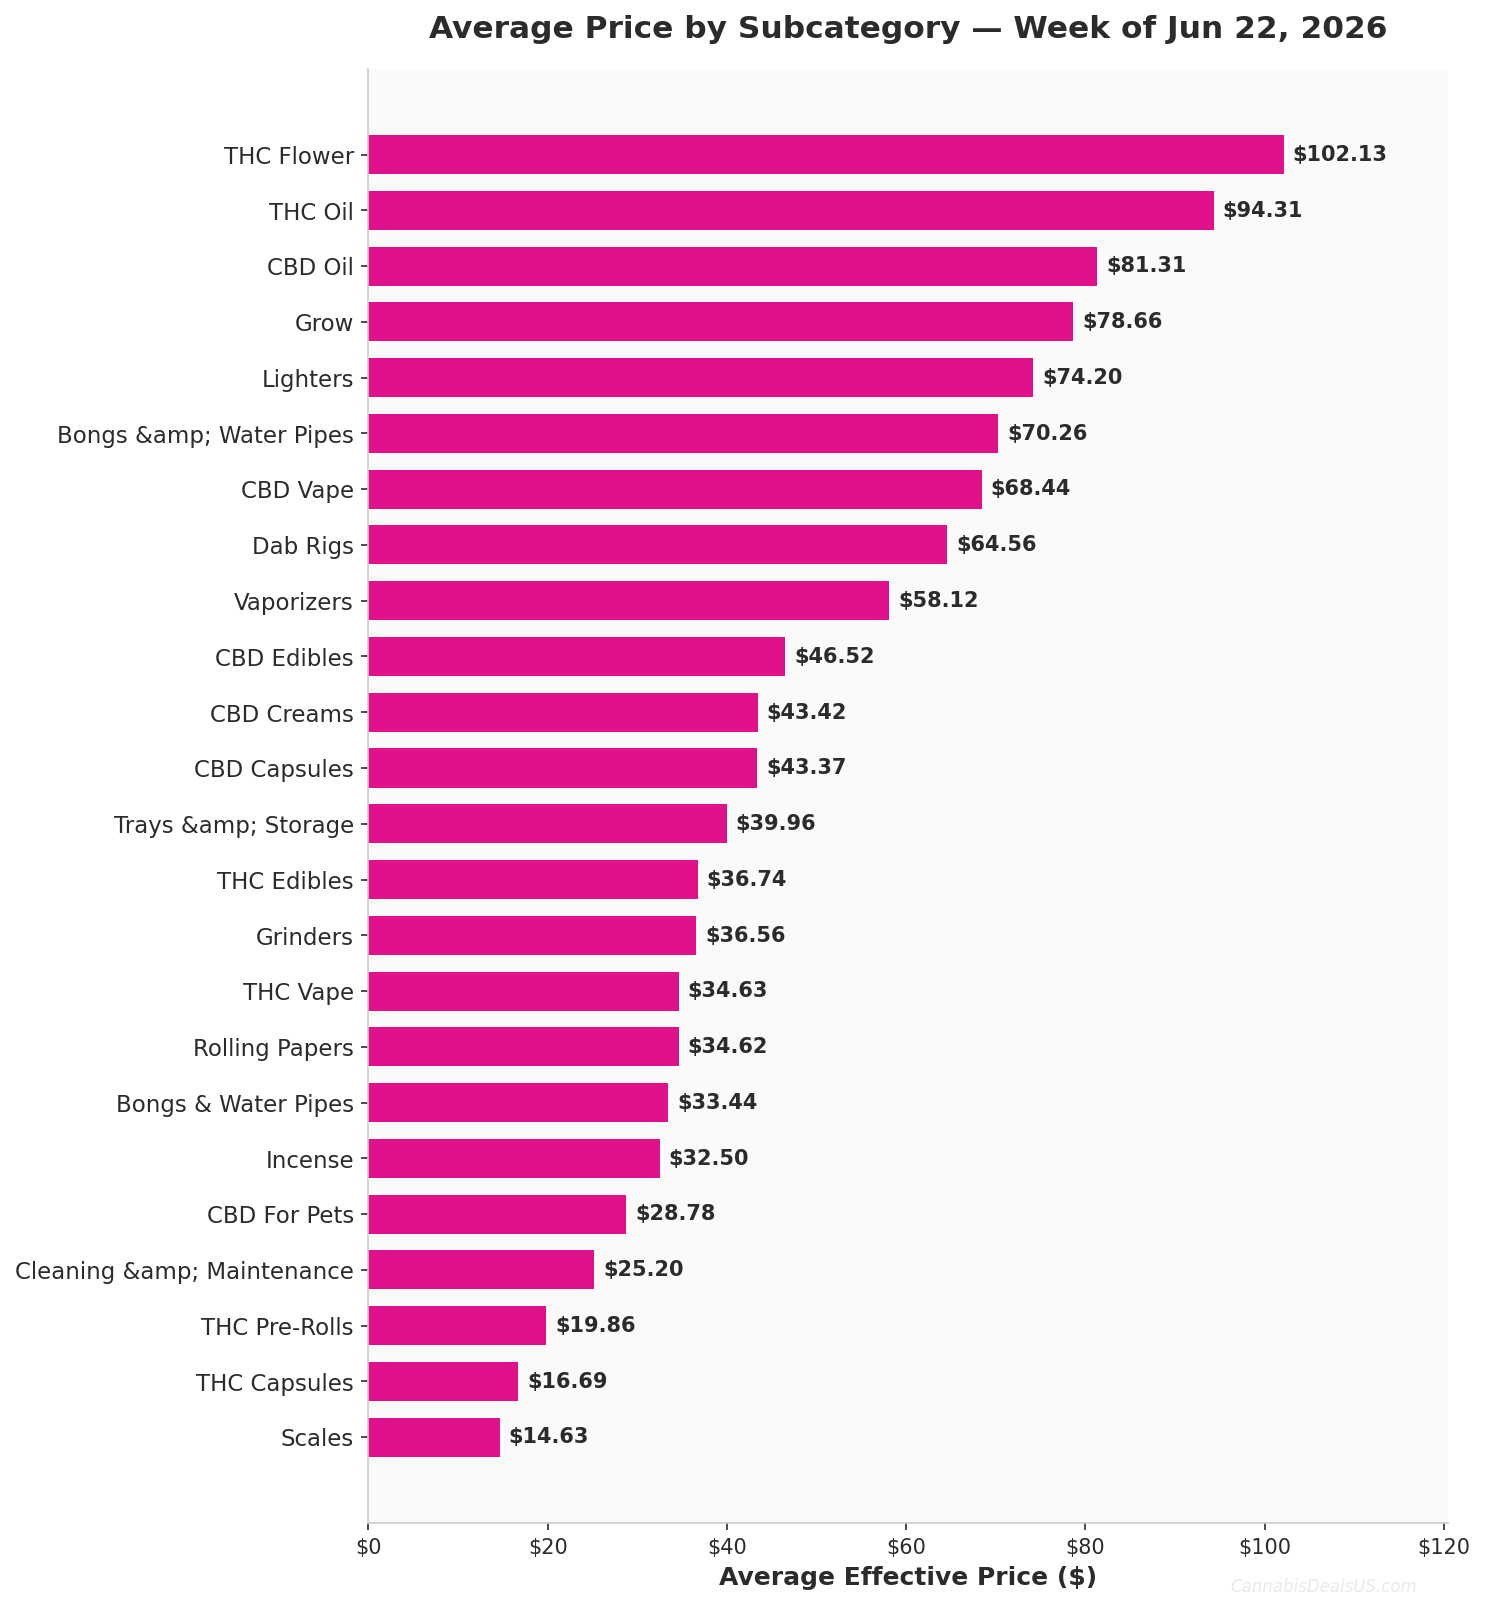
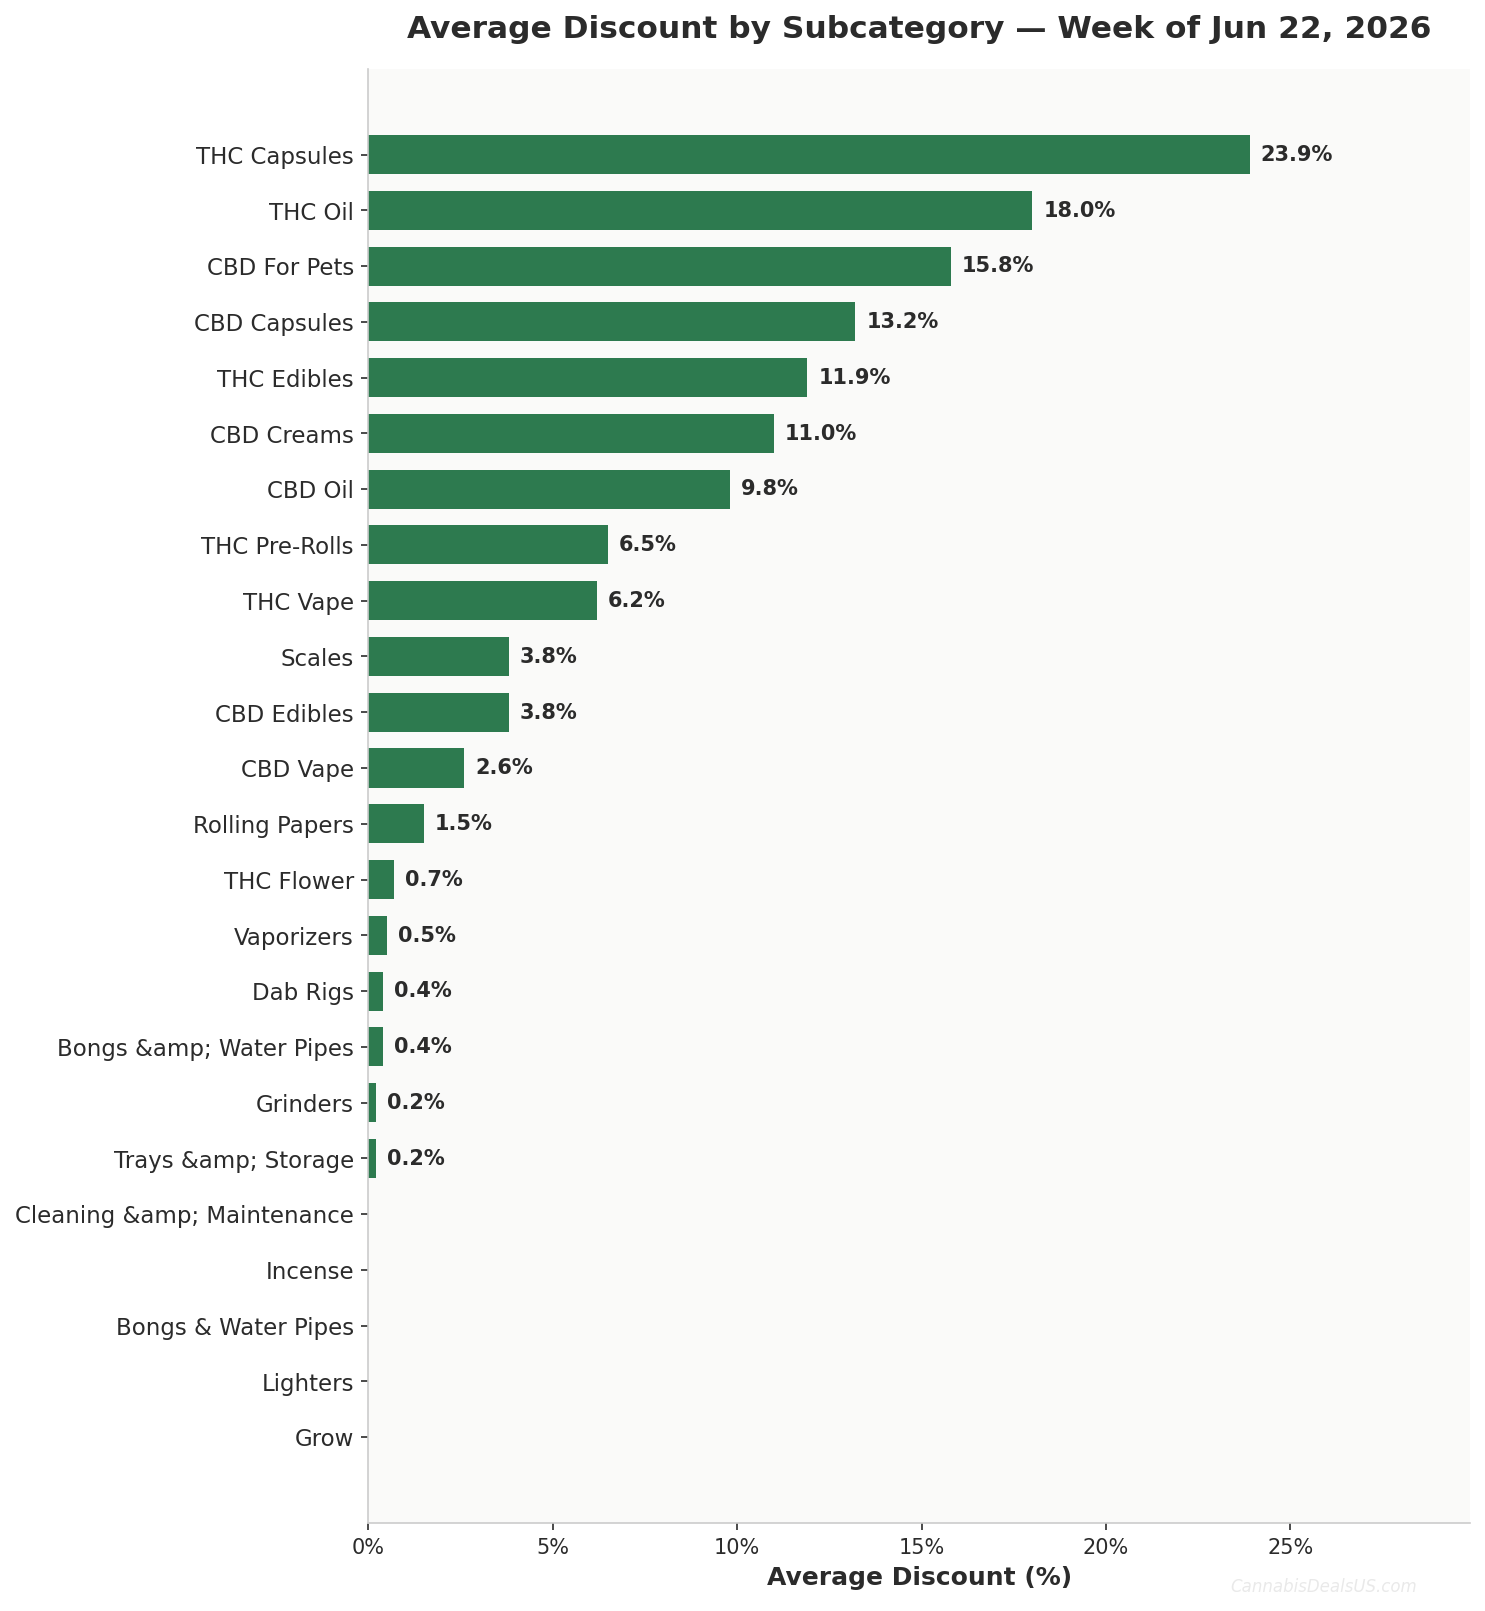
| CBD Oil | $81.31 | -0.3% | 9.8% | 599 |
| CBD Vape | $68.44 | +0.0% | 2.6% | 279 |
| CBD Edibles | $46.52 | -0.2% | 3.8% | 1,485 |
| CBD Creams | $43.42 | -0.5% | 11.0% | 262 |
| CBD Capsules | $43.37 | +0.1% | 13.2% | 131 |
| CBD For Pets | $28.78 | -0.4% | 15.8% | 143 |
THC Subcategories
| Category | Avg Price | WoW Price Change | Avg Discount | SKUs |
|---|---|---|---|---|
| THC Flower | $102.13 | 0% | 0.7% | 673 |
| THC Oil | $94.31 | -0.0% | 18.0% | 111 |
| THC Edibles | $36.74 | -0.3% | 11.9% | 1,628 |
| THC Vape | $34.63 | -0.1% | 6.2% | 3,270 |
| THC Pre-Rolls | $19.86 | +0.1% | 6.5% | 1,060 |
| THC Capsules | $16.69 | +0.1% | 23.9% | 51 |
Headshop & Other Subcategories
| Category | Avg Price | WoW Price Change | Avg Discount | SKUs |
|---|---|---|---|---|
| Grow | $78.66 | 0% | 0% | 1,466 |
| Lighters | $74.20 | 0% | 0% | 14 (low sample, interpret with caution) |
| Bongs & Water Pipes | $70.26 | 0% | 0.4% | 12,753 |
| Dab Rigs | $64.56 | +0.0% | 0.4% | 6,005 |
| Vaporizers | $58.12 | +0.0% | 0.5% | 4,020 |
| Trays & Storage | $39.96 | +0.0% | 0.2% | 4,986 |
| Grinders | $36.56 | -0.1% | 0.2% | 2,307 |
| Rolling Papers | $34.62 | -0.3% | 1.5% | 631 |
| Bongs & Water Pipes | $33.44 | +0.0% | 0.0% | 1,342 |
| Incense | $32.50 | -0.0% | 0% | 308 |
| Cleaning & Maintenance | $25.20 | +0.0% | 0% | 365 |
| Scales | $14.63 | -0.0% | 3.9% | 26 (low sample, interpret with caution) |
— = Newly broken out subcategory; no prior-week comparison available. * = Catalogue update event; WoW not comparable.
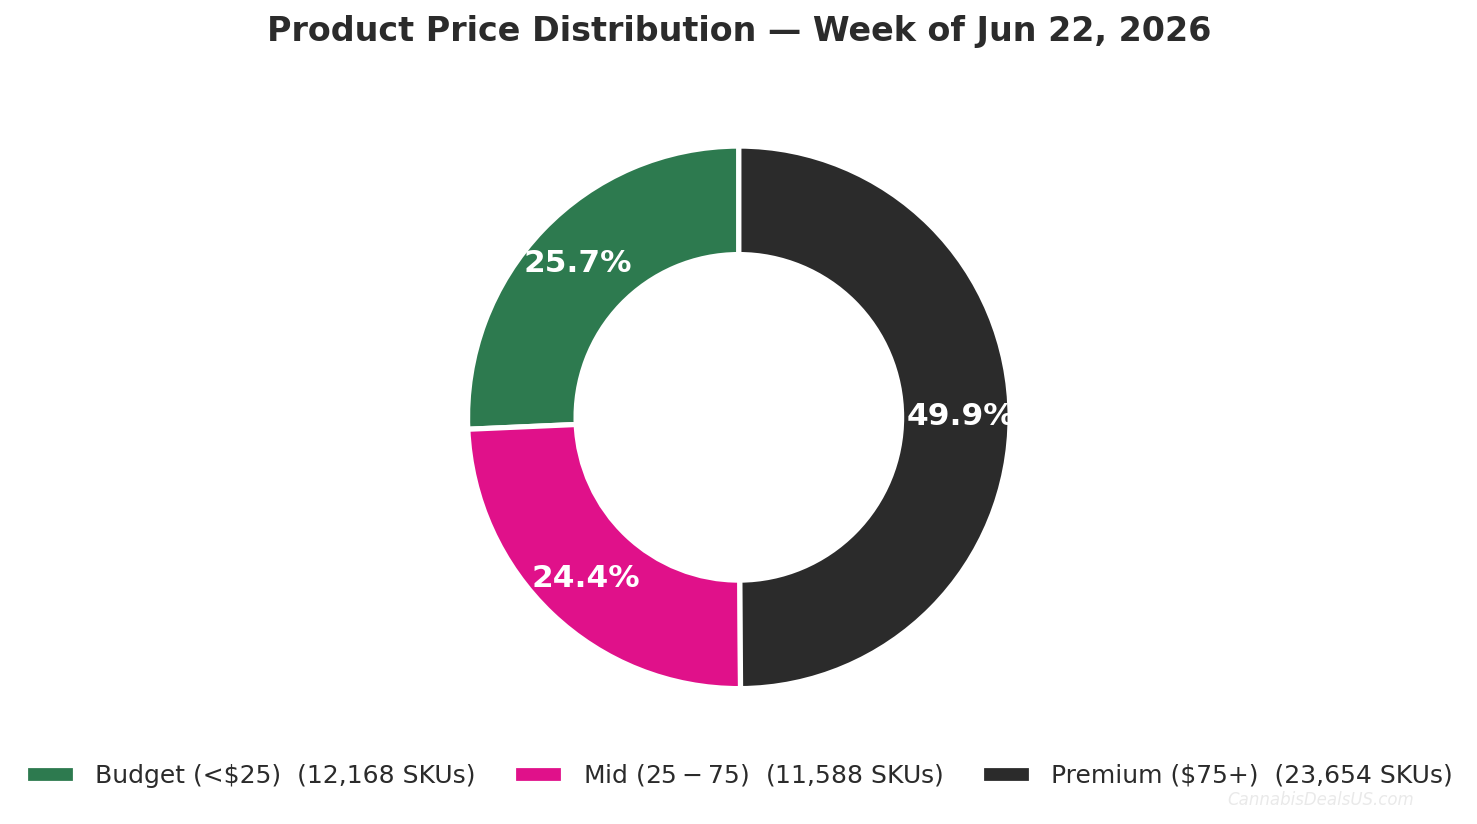
Price Distribution
| Price Tier | Range | Share of Market | SKUs |
|---|---|---|---|
| Budget | Under $25 | 25.7% | 12,168 |
| Mid-Range | $25–$75 | 24.4% | 11,588 |
| Premium | Over $75 | 12.6% | 5,966 |
Average Price by Subcategory
Average Discount by Subcategory
What to Watch
- CBD Creams declined 0.5% to $43.42 across 262 tracked products.
- CBD For Pets declined 0.4% to $28.78 across 143 tracked products.
- Rolling Papers declined 0.3% to $34.62 across 631 tracked products.
How to Cite This Index
CannabisDealsUS Cannabis Price Index — a weekly dataset tracking online cannabis retail pricing across 30,000+ products from 200+ verified U.S. merchants and brands.
Dataset (all versions):
https://doi.org/10.5281/zenodo.18351089
License: CC BY-NC 4.0
Need full CPI dataset access?
Get extended CPI data, historical exports, and deeper insights.
Explore More
Published by Theo Valmis, Founder, CannabisDealsUS.
Last Updated on June 22, 2026 by Theo Valmis