
420 is not a price event. It is a discount visibility event.
Based on weekly tracking of 30,000+ online cannabis SKUs across U.S. retailers.
4.3%
SKUs discounted on 420
vs ~2% weekly structural baseline
35.5%
Avg discount depth
unchanged week-on-week
105.3
Price index (Apr 20)
vs 105.2 prior week — flat
~1.5%
Effective market-wide discount
below 1.9% pre-event floor
8 confirmed 420 promotions active. Smoke Cartel running 80%+10% off on 9,539 SKUs — 24% of the tracked catalogue. Index penetration: 4.3%, below the 5.2% pre-event floor. The savings were real. The index could not see them: 420 2026 was structurally a code-based event.
Data source: CannabisDealsUS Cannabis Price Index. 400,000+ product-week observations, December 2025 – April 20, 2026. Dataset DOI: 10.5281/zenodo.18351090. License: CC BY-NC 4.0. Published: April 21, 2026.
Quote-Ready Stats — April 20, 2026
- “Only 4.3% of online cannabis SKUs carried an active sale price on April 20, 2026.”
- “Average discount depth held at 35.5% — statistically unchanged from the week before.”
- “420 2026 produced no detectable movement in feed-level cannabis prices. The index held at 105.3.”
- “Market-wide effective discount on 420 day: ~1.5% — below the 1.9% pre-event baseline.”
- “Hardware discount penetration (1–3%) did not converge with consumable penetration (12–17%) on 420 day.”
- “420 2026 savings were predominantly code-based and therefore structurally invisible to feed-level pricing measurement.”
- “Most cannabis products are not discounted, even on 420.”
Source: CannabisDealsUS Cannabis Price Index · DOI: 10.5281/zenodo.18351090 · CC BY-NC 4.0 · Free to cite with attribution
What the Data Shows
The April 20, 2026 snapshot is the most revealing data point in the CannabisDealsUS Cannabis Price Index tracking period. Not because it recorded a promotional spike — but because it didn’t.
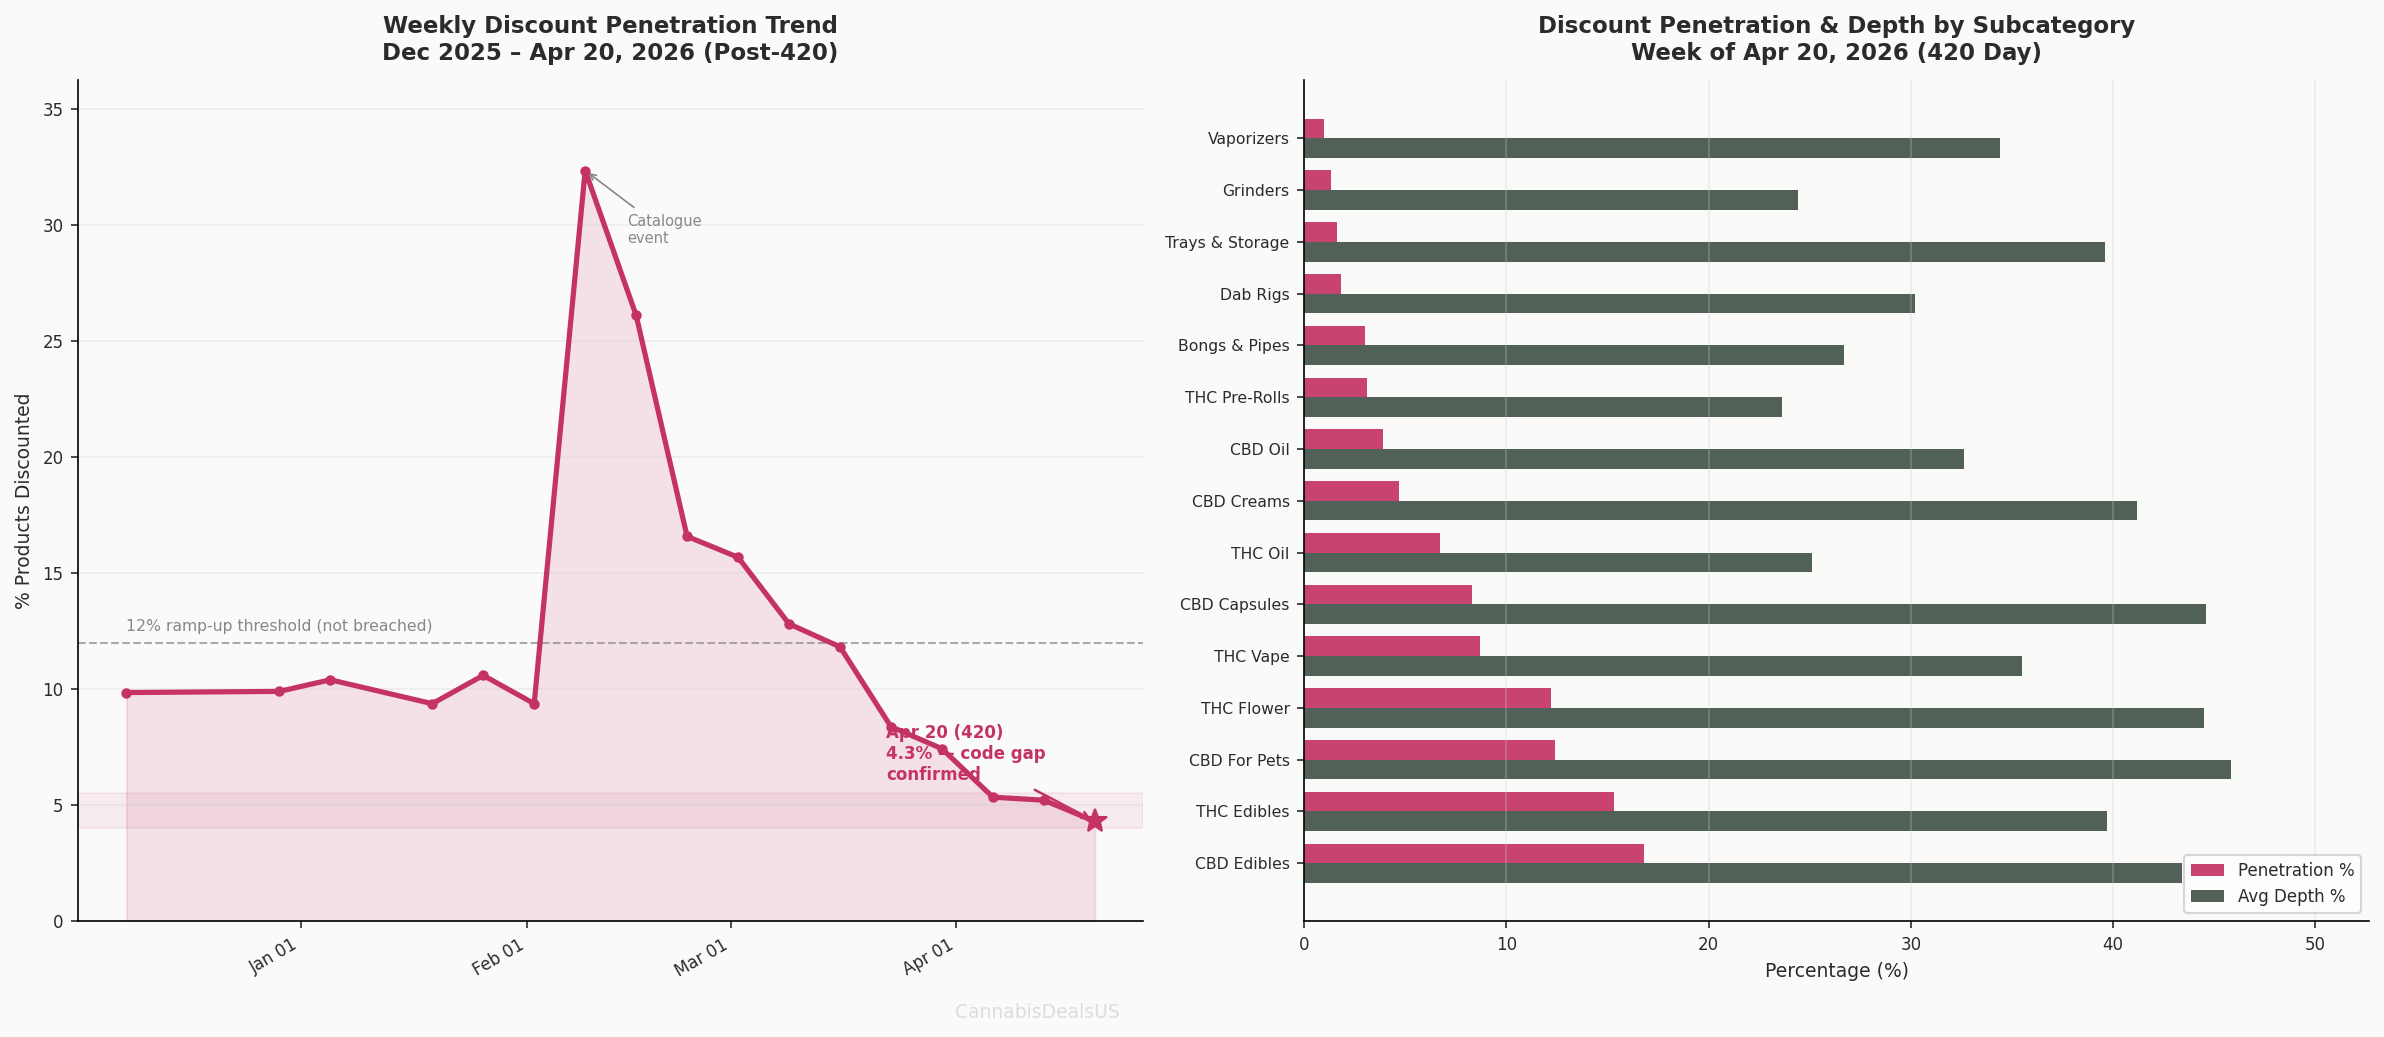
Overall discount penetration fell to 4.3%, down from 5.2% the prior week (−0.9pp). Every tracked subcategory declined. The index value moved from 105.23 to 105.29 — a change of 0.06 points, well within noise. Average effective price was essentially unchanged at $58.29 vs $58.25 the prior week.
Eight confirmed 420 promotions were active, covering some of the largest merchants in the tracked catalogue. Smoke Cartel — 9,539 SKUs, 24% of the tracked catalogue — ran up to 80% + 10% off sitewide. DankStop, FAB CBD, and NuLeaf Naturals ran identical structures. Lazarus Naturals ran 30% off, auto-applied. Session Goods ran up to 55% off, auto-applied from April 1. None of this produced a detectable penetration increase in the index.
The index measures feed-level pricing. 420 2026 was a code-based event. The savings were real — the index just couldn’t see them.
Actual vs Projected: April 20 Outcome
| Metric | Pre-Event Floor (Apr 13) | Projected Range | Actual (Apr 20) | vs Projection |
|---|---|---|---|---|
| Discount penetration | 5.2% | 10–20% | 4.3% | Below floor — code gap confirmed |
| Avg discount depth | 35.9% | 35–45% | 35.5% | Within range — structurally stable |
| Effective discount (market-wide) | 1.9% | 4–9% | 1.5% | Below floor — code gap confirmed |
| Index value | 105.23 | 95–105 (price pressure) | 105.29 | Flat — no price movement |
| SKUs tracked (agg) | 33,807 | 39,000–41,000 | 33,988 | Flat — no catalogue expansion on event day |
The Code Gap: Confirmed at Scale
Before April 20, the report flagged a structural limitation: 6 of 8 confirmed 420 offers were code-based, and code-based savings typically do not appear as sale_price in merchant product feeds. The April 20 data confirms this at scale.
The largest single-catalogue offer in the index — Smoke Cartel’s SMOKE420 covering 9,539 SKUs — produced zero detectable penetration movement in the Headshop subcategories. Bongs & Water Pipes fell from 3.4% to 3.0%. Dab Rigs fell from 2.2% to 1.8%. Grinders fell from 1.5% to 1.3%. A merchant running 80% + 10% off its entire catalogue left no fingerprint in the feed-level data.
Session Goods (auto-applied, up to 55% off through April 22) also failed to produce a detectable penetration spike, suggesting either that Session Goods products are not in significant quantity in the tracked feed, or that the auto-applied discount structure was applied differently than standard sale_price fields.
“The April 20 index reading of 4.3% penetration — below the 5.2% pre-event floor — is not a measurement of low 420 activity. It is a measurement of how feed-level pricing indices interact with code-based promotional structures. The consumer savings were real. The index could not see them.”
— CannabisDealsUS Cannabis Price Index, April 2026
Category Performance: What the Index Did Record
Even within feed-visible data, the pattern is instructive. Categories with structurally high baseline penetration maintained the highest 420-day readings — but all declined WoW.
| Subcategory | 420-Day Penetration | WoW vs Apr 13 | Avg Depth | SKUs |
|---|---|---|---|---|
| CBD Edibles | 16.8% | −3.9pp | 43.4% | 731 |
| THC Edibles | 15.3% | −4.0pp | 39.7% | 1,870 |
| CBD For Pets | 12.4% | −1.2pp | 45.8% | 185 |
| THC Flower | 12.2% | −4.1pp | 44.5% | 890 |
| CBD Capsules | 8.3% | −3.6pp | 44.6% | 145 |
| THC Vape | 8.7% | −2.0pp | 35.5% | 3,957 |
| THC Oil | 6.7% | −1.7pp | 25.1% | 134 |
| CBD Creams | 4.7% | −1.2pp | 41.2% | 253 |
| CBD Oil | 3.9% | −0.9pp | 32.6% | 689 |
| THC Pre-Rolls | 3.1% | −0.4pp | 23.6% | 1,115 |
| Bongs & Water Pipes | 3.0% | −0.4pp | 26.7% | 9,481 |
| Dab Rigs | 1.8% | −0.4pp | 30.2% | 2,872 |
| Grinders | 1.3% | −0.3pp | 24.4% | 1,964 |
| Vaporizers | 1.0% | −0.1pp | 34.4% | 2,490 |
WoW = week-on-week change in discount penetration vs April 13, 2026 final pre-activation floor. All subcategories declined. THC Capsules not shown (0.0% penetration on 56 SKUs — low sample).
Hardware vs Consumables: No Convergence on 420
One of the clearest pre-event predictions was that Smoke Cartel and DankStop’s headshop-heavy promotional activation would reduce the structural gap between hardware and consumable discounting. This did not happen in the feed-level data.
Hardware categories on April 20: Bongs & Water Pipes 3.0% (−0.4pp), Dab Rigs 1.8% (−0.4pp), Grinders 1.3% (−0.3pp), Trays & Storage 1.6% (−0.4pp). All declined. The hardware-consumable gap — which has been a structural feature of the index since tracking began — was unchanged on the industry’s highest-promotional-intensity day of the year.
Consumable categories maintained higher absolute penetration but also declined: CBD Edibles led at 16.8%, THC Edibles at 15.3%, THC Flower at 12.2%. The consumable categories that held the deepest discounts were CBD For Pets (45.8% depth), CBD Capsules (44.6%), and THC Flower (44.5%) — all at or above their pre-event levels.
“Hardware discount penetration did not respond to confirmed 420 headshop promotions. The structural divide between hardware (1–3% penetration) and consumables (12–17% penetration) held through April 20 — reinforcing that hardware savings on 420 are concentrated in code-based offers that do not register at the feed level.”
— CannabisDealsUS Cannabis Price Index, April 2026
Looking for current hardware deals? Browse headshop comparisons and active offers →
Discount Activity Peaked Before 420 and Declined on the Day Itself
What This Means for the Index
The April 20 outcome provides the clearest evidence to date of how feed-level cannabis pricing indices interact with the industry’s primary promotional mechanic. Several observations are now data-confirmed:
- Code-only promotions are structurally invisible to feed-level indices. The April 20 data is unambiguous: eight confirmed promotions, including 80%+ offers from merchants representing over 25% of the tracked catalogue, produced no detectable feed-level signal.
- Discount depth is structurally stable regardless of event intensity. Average depth held at 35.5% on April 20 — within 0.4pp of every prior week since late March. When promotions are code-based, depth cannot rise in the index because the discounted products simply are not counted.
- The hardware-consumable structural divide persists under maximum promotional pressure. If headshop promotions from the two largest tracked headshop merchants cannot move hardware penetration on 420, the divide reflects a structural difference in how hardware vs. consumable merchants apply pricing in their product feeds.
- The pre-event setup (5.2% floor) was accurate. The floor established through April 13 correctly represented feed-visible discount conditions. The April 20 reading declined further, consistent with a merchant pattern of resetting even residual feed-level discounts as code-based activations went live.
Looking Ahead
The post-420 normalisation period (April 21–May) will show whether the consumable categories that held elevated penetration through the tracking period (CBD Edibles 16–21%, THC Edibles 15–20%) revert toward the structural baseline, or whether promotional activity holds above the Q1 average range of 8–12%.
The CannabisDealsUS Cannabis Price Index will continue weekly tracking. The April 27 snapshot will be the first post-event reading. The primary signal to watch: whether overall penetration rebounds above the 5.2% pre-event floor as code-based promotional windows close and merchants reset to standard feed-level pricing.
420 Cannabis Pricing Reality (2026 Data Snapshot)
Data snapshot: April 20, 2026 · CannabisDealsUS Cannabis Price Index · 33,988 SKUs tracked
4.3%
SKUs with active sale price
35.5%
Avg depth where discounted
105.3
Price index (baseline = 100)
~1.5%
Market-wide effective discount
The finding: 420 increases discount visibility, not price levels. Penetration was elevated vs. the ~2% structural baseline — but depth and prices were statistically unchanged. The market did not move. The savings were in codes the index cannot measure.
CannabisDealsUS Cannabis Price Index · DOI: 10.5281/zenodo.18351090 · CC BY-NC 4.0 · Free to cite with attribution
How to Cite This Report
CannabisDealsUS Cannabis Price Index — 420 2026 Post-Event Impact Report. Published April 21, 2026. Dataset archived on Zenodo with persistent DOI for reproducible research and policy citation.
Zenodo DOI:
https://doi.org/10.5281/zenodo.18351090
Concept DOI — resolves to latest version automatically.
License: CC BY-NC 4.0
Need full CPI dataset access?
Get extended CPI data, historical exports, and deeper insights.
Related Resources
- 420 Cannabis Deals Report 2026 — Full Tracking History
- State of Cannabis Pricing Q1 2026
- How Cannabis Discounts Really Work
- How Cannabis Pricing Works Online
- Which Cannabis Categories Have the Highest Price Volatility
Published by Theo Valmis, Founder, CannabisDealsUS.
Last Updated on August 2, 2026 by Theo Valmis