
The CannabisDealsUS Cannabis Price Index tracked 29,078 online cannabis products this week, with the market average settling at $53.41 per product and average discounting at 2.6%. THC Edibles posted the largest price decline among well-sampled segments at -5.1% week-on-week, while Mushrooms recorded the strongest gain at +6.0%, and THC Oil rose 30.6% on a low-volume sample of 20 SKUs.
This Week at a Glance
| $53.41 | 2.6% | 29,078 |
|---|---|---|
| Average Product Price | Average Discount | SKUs Tracked |
Quote-Ready Insights
“The CannabisDealsUS Cannabis Price Index tracked 29,078 online cannabis products for the week of March 16, 2026, with the composite index rising 0.67% week-on-week to 106.59 and a market average price of $53.41.”
“THC Edibles declined 5.1% in average price this week to $30.83, the largest price movement among high-volume THC segments, while the broader THC segment averaged $34.44 per product across 5,052 SKUs.”
“CBD products carried the deepest discounting in the index this week at an average of 10.2% off regular price, compared to 9.7% across THC products and 0.7% across headshop, grow, and vaporizer categories.”
Access deeper data cuts and full dataset.
CBD & THC Market Snapshot
| Segment | Avg Price | Avg Discount | SKUs Tracked |
|---|---|---|---|
| Overall | $53.41 | 2.6% | 29,078 |
| CBD | $49.38 | 10.2% | 1,129 |
| THC | $34.44 | 9.7% | 5,052 |
| Other (Headshop, Vaporizers, Grow, Mushrooms) | $57.80 | 0.7% | 22,897 |
CBD Subcategories
| Category | Avg Price | WoW Price Change | Avg Discount | SKUs |
|---|---|---|---|---|
| CBD Oil | $65.37 | -1.1% | 3.8% | 278 |
| CBD Creams | $65.58 | -1.3% | 6.3% | 120 |
| CBD Edibles | $41.38 | -1.7% | 12.3% | 572 |
| CBD For Pets | $34.50 | +0.2% | 15.2% | 120 |
| CBD Capsules | $48.54 | +0.5% | 20.6% | 39 (low sample, interpret with caution) |
THC Subcategories
| Category | Avg Price | WoW Price Change | Avg Discount | SKUs |
|---|---|---|---|---|
| THC Flower | $48.00 | -0.1% | 10.3% | 767 |
| THC Vape | $36.51 | -1.3% | 6.0% | 2,348 |
| THC Edibles | $30.83 | -5.1% | 17.7% | 1,070 |
| THC Pre-Rolls | $20.83 | +0.4% | 9.4% | 828 |
| THC Oil | $42.22 | +30.6% | 5.6% | 20 (low sample, interpret with caution) |
| THC Capsules | $19.35 | +1.4% | 5.5% | 19 (low sample, interpret with caution) |
Headshop & Other Subcategories
| Category | Avg Price | WoW Price Change | Avg Discount | SKUs |
|---|---|---|---|---|
| Dab Rigs | $88.56 | 0.0% | 1.0% | 1,898 |
| Bongs & Water Pipes | $83.96 | 0.0% | 0.7% | 5,460 |
| Vaporizers | $65.61 | -0.3% | 0.4% | 4,216 |
| Grow | $49.05 | -1.7% | 0.4% | 1,409 |
| Mushrooms | $41.23 | +6.0% | 5.9% | 206 |
| Headshop | $38.66 | +0.1% | 0.5% | 2,211 |
| Grinders | $36.41 | -0.4% | 0.4% | 1,608 |
| Trays & Storage | $34.21 | -0.5% | 0.8% | 4,110 |
| Rolling Papers | $33.18 | +2.2% | 1.1% | 1,450 |
| Cleaning & Maintenance | $30.20 | -0.3% | 0.2% | 329 |
Price Distribution
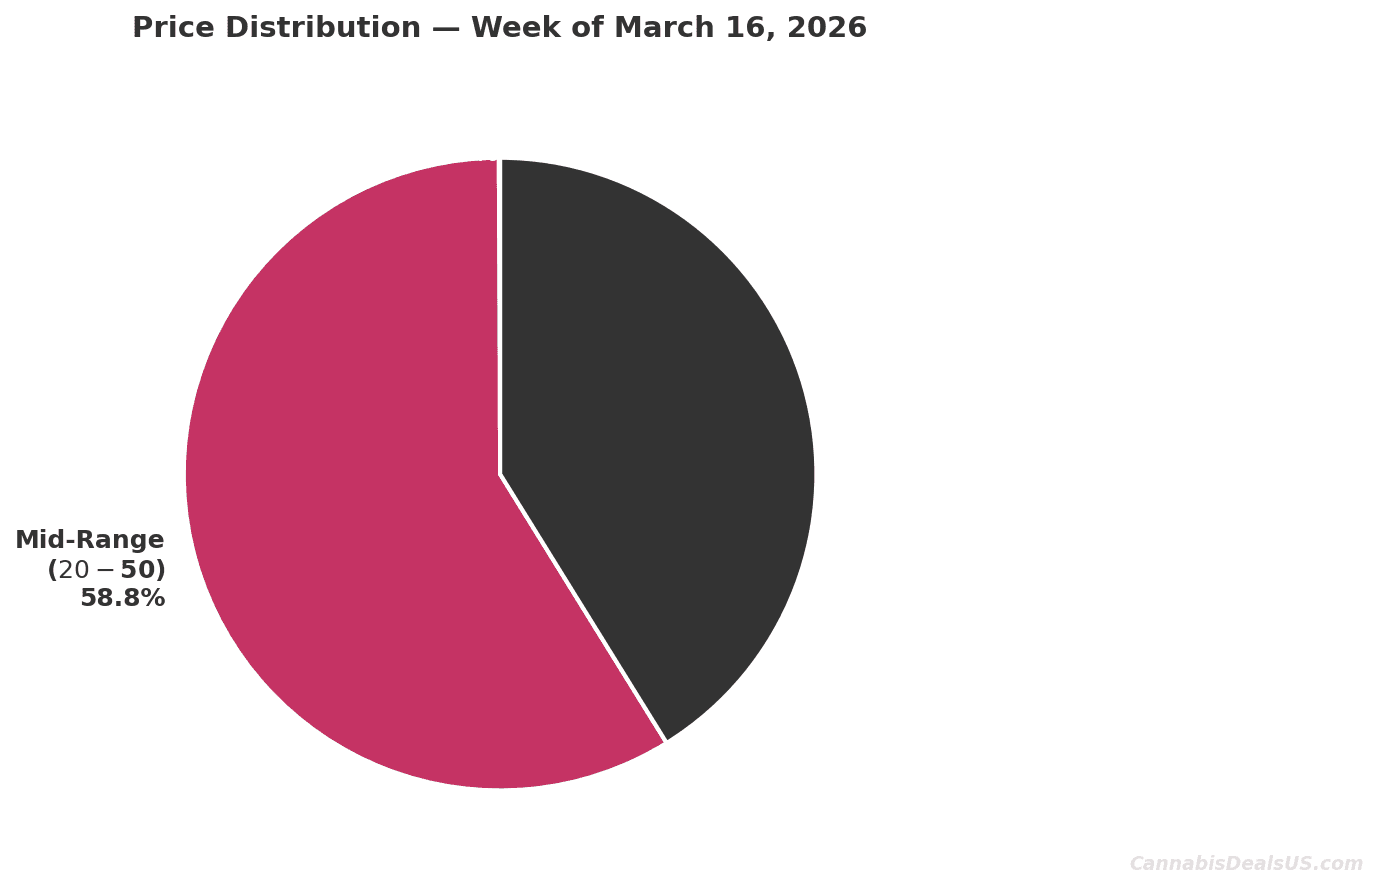
| Price Tier | Range | Share of Market |
|---|---|---|
| Budget | Under $20 | 0.1% |
| Mid-Range | $20-$50 | 58.8% |
| Premium | Over $50 | 41.2% |
Mid-range products between $20 and $50 accounted for 58.8% of the index this week, with premium-priced products above $50 representing 41.2% of tracked SKUs. The mid-range tier is anchored by high-volume categories including THC Edibles, THC Vape, and Trays and Storage, while the premium tier is driven by hardware-heavy segments such as Dab Rigs, Bongs and Water Pipes, and Vaporizers.
Average Price by Subcategory
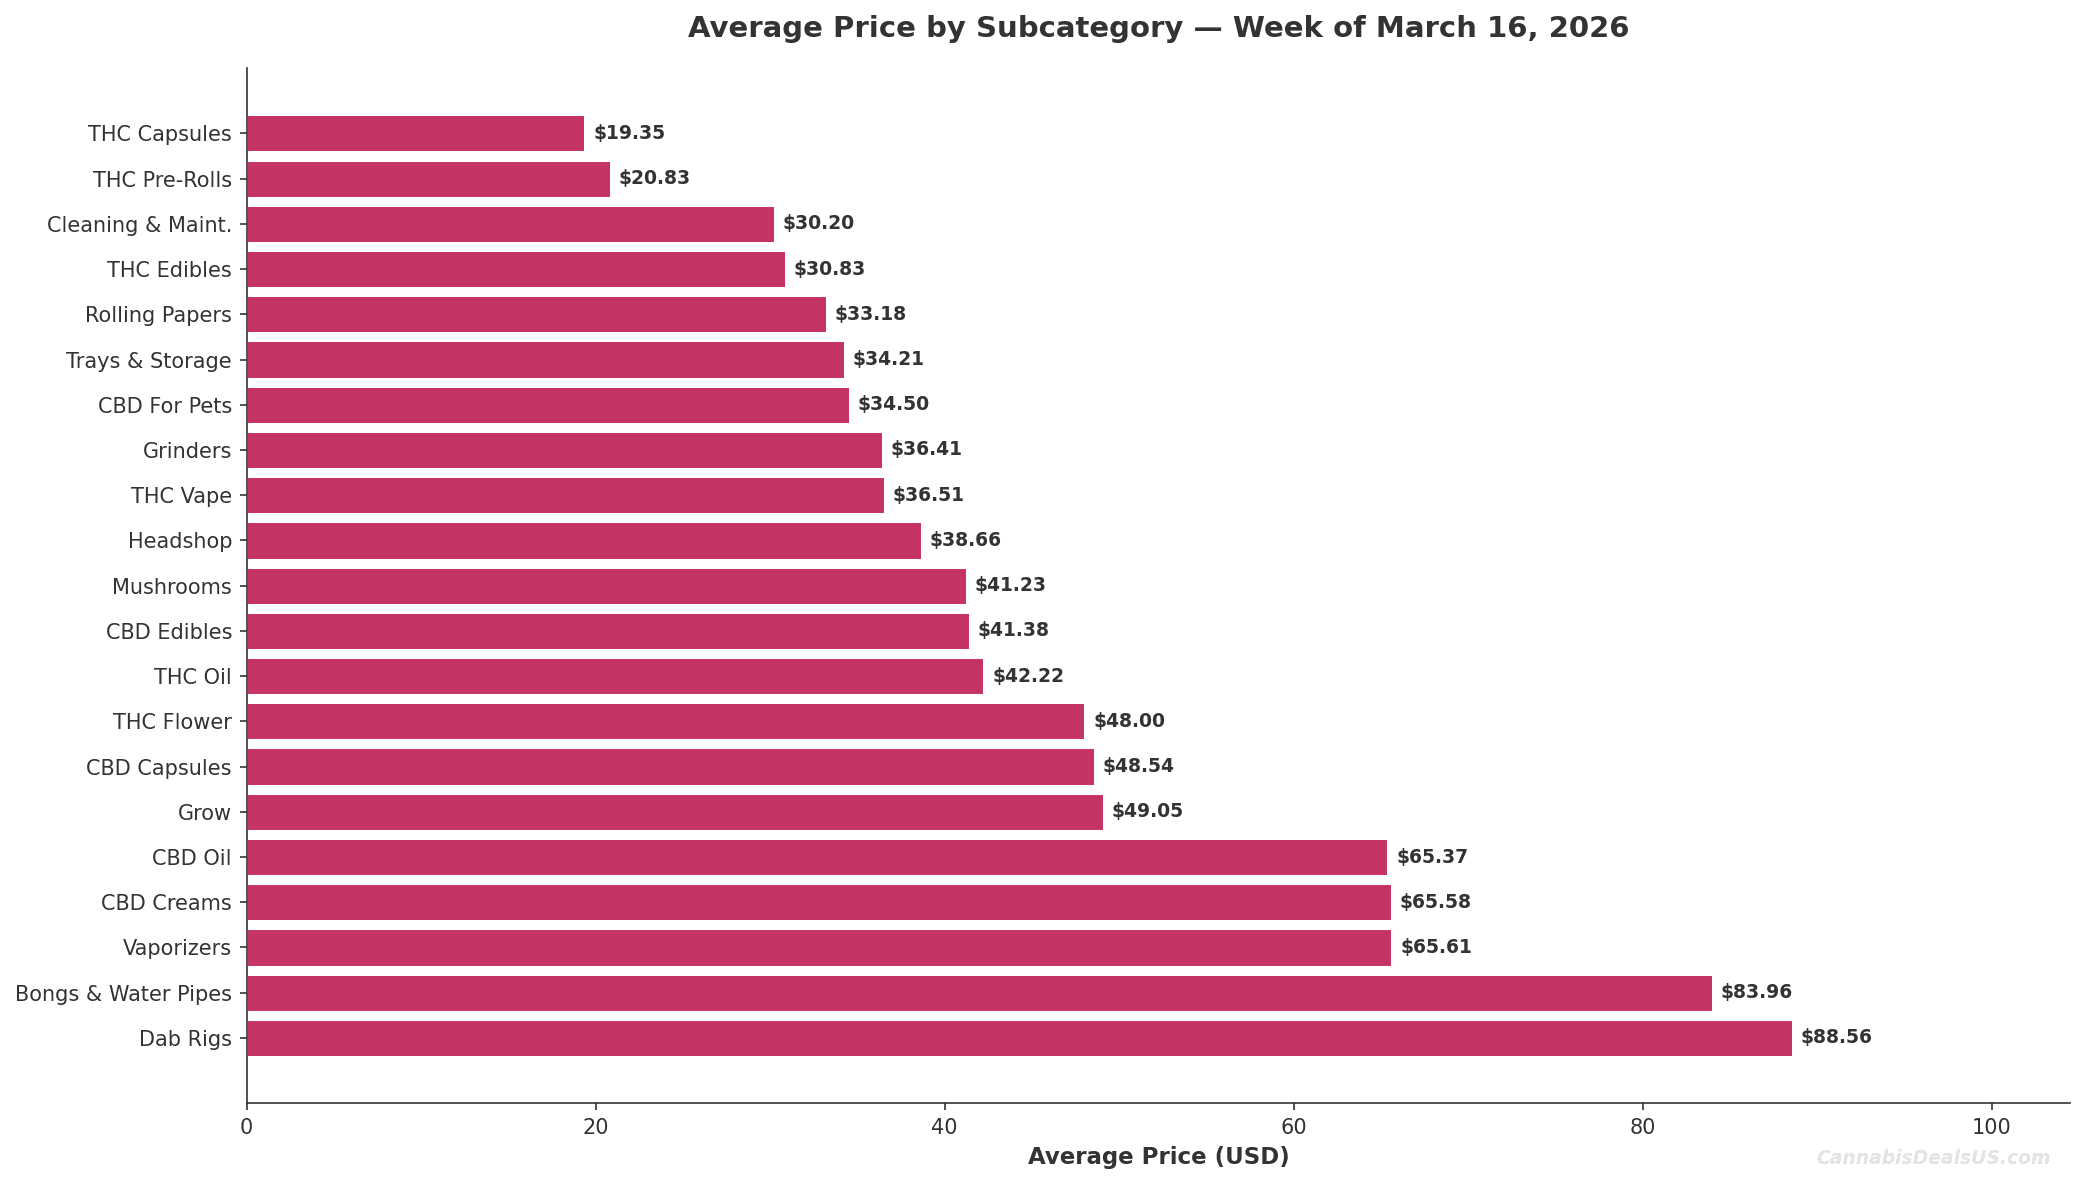
Dab Rigs recorded the highest average price across all tracked segments at $88.56, followed by Bongs and Water Pipes at $83.96 and Vaporizers at $65.61. Within the THC segment, THC Flower averaged $48.00 while THC Pre-Rolls sat at $20.83, reflecting the broad price range across cannabis consumption formats. Cleaning and Maintenance products held the lowest average in the index at $30.20.
Average Discount by Subcategory
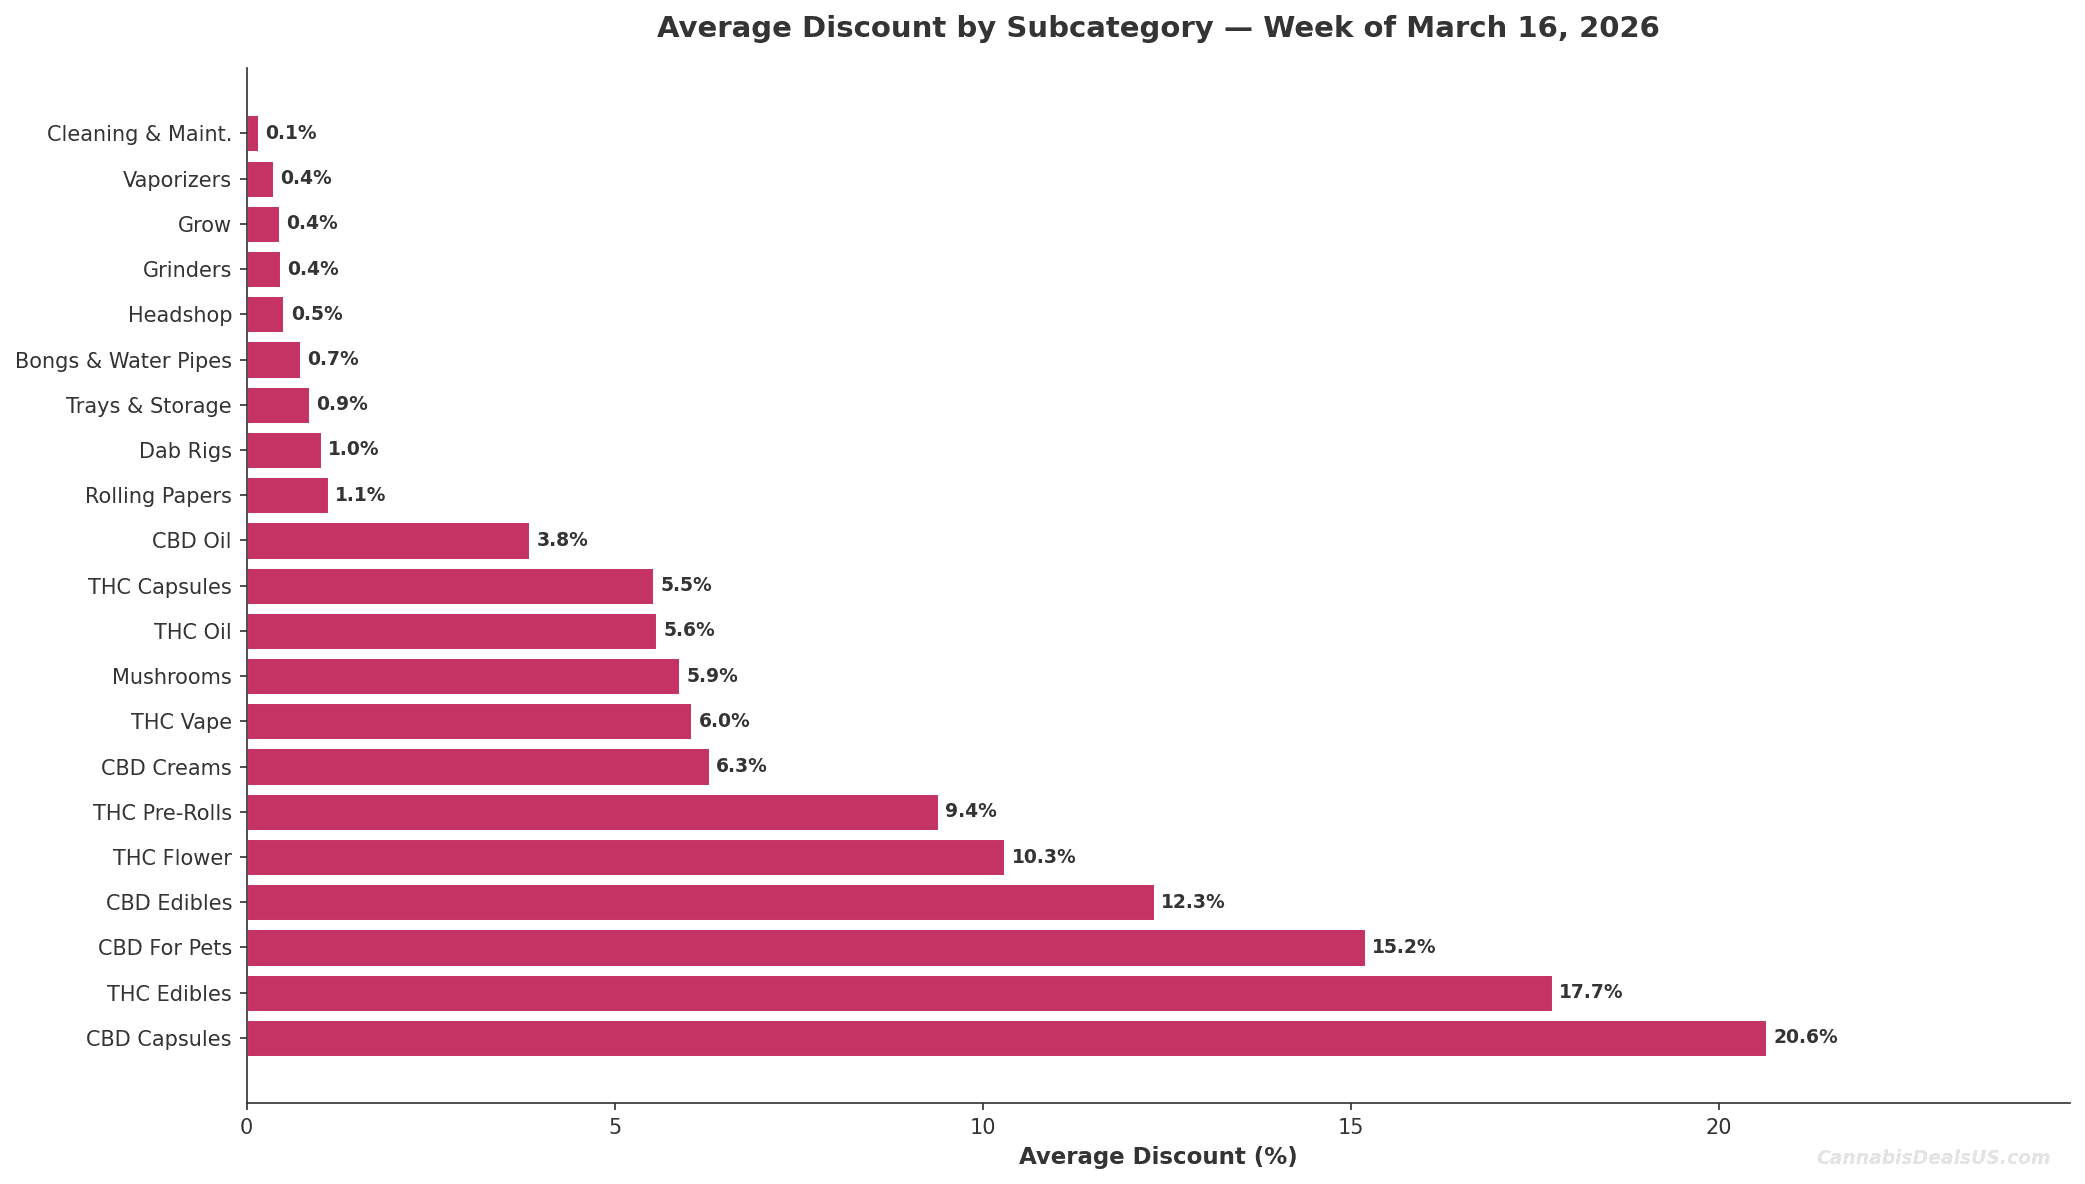
CBD Capsules carried the deepest average discount at 20.6%, followed by THC Edibles at 17.7% and CBD For Pets at 15.2%. Headshop and hardware categories continued to show minimal discounting, with Vaporizers at 0.4%, Grinders at 0.4%, and Bongs and Water Pipes at 0.7%. The discount gap between consumable cannabis products and hardware accessories remained pronounced, with CBD and THC segments averaging over 9% off versus under 1% for most headshop subcategories.
What to Watch
- THC Edibles declined 5.1% in average price this week after rising 10.9% the prior week – the segment has now moved in opposite directions in consecutive weeks, and the direction it settles next week will indicate whether the prior period’s rise reflected a temporary catalogue shift.
- Mushrooms rose 6.0% week-on-week to $41.23 average, continuing an upward trend from $38.91 the prior week and $37.65 the week before – this segment has now posted three consecutive weeks of price increases.
- THC Oil’s 30.6% week-on-week movement is based on a 20-SKU sample; catalogue composition changes in this subcategory are the more likely driver, and the segment warrants monitoring as product count grows.
How to Cite This Index
Data from the CannabisDealsUS Cannabis Price Index, a weekly dataset tracking online cannabis retail
pricing across thousands of products from 200+ verified merchants and brands.
Dataset DOI: Zenodo.
License: CC BY-NC 4.0.
Need full dataset access? View CPI data tiers.
Explore More
- How the Cannabis Price Index Works
- Cannabis Price Index Use Cases
- How Cannabis Pricing Works Online
- How Cannabis Discounts Really Work
Published by Theo Valmis, Founder, CannabisDealsUS.
Dataset DOI: 10.5281/zenodo.18351090. License: CC BY-NC 4.0.
Last Updated on April 8, 2026 by Theo Valmis