Weekly pricing data across 35,000+ hemp-derived cannabinoid products sold online.
Independent market signals for analysts, journalists, and researchers.
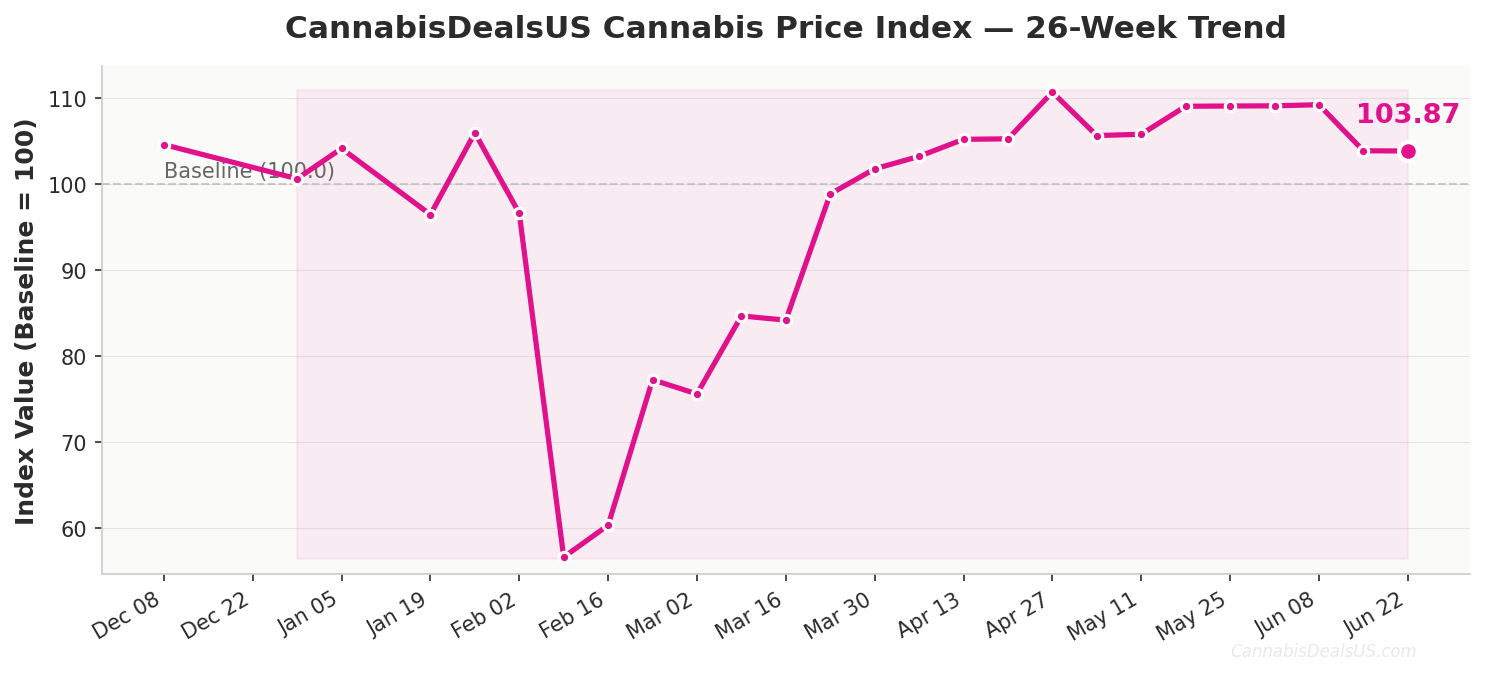
The CannabisDealsUS Cannabis Price Index measures weekly online retail prices for hemp-derived CBD and THC products, benchmarked to a fixed baseline (index = 100).
Covers federally legal hemp-derived products (CBD, Delta-8, Delta-9 compliant THC, THCA, HHC) sold under the U.S. Farm Bill framework. Does not track dispensary pricing or wholesale cannabis markets.
35,000+ SKUs tracked weekly · 200+ verified merchants ·
Methodology ·
Media & press kit
Latest Cannabis Price Index Snapshot
Latest Market Signals
Featured Reports
Coverage Snapshot
Hemp-derived cannabinoid categories: CBD oils, edibles, topicals, capsules · THC flower, vapes, edibles, pre-rolls · Vaporizer devices · Headshop accessories.
Price Trends
Based on 15 weekly snapshots through April 6, 2026
Key structural patterns from recent weeks of index data.
CBD Pricing
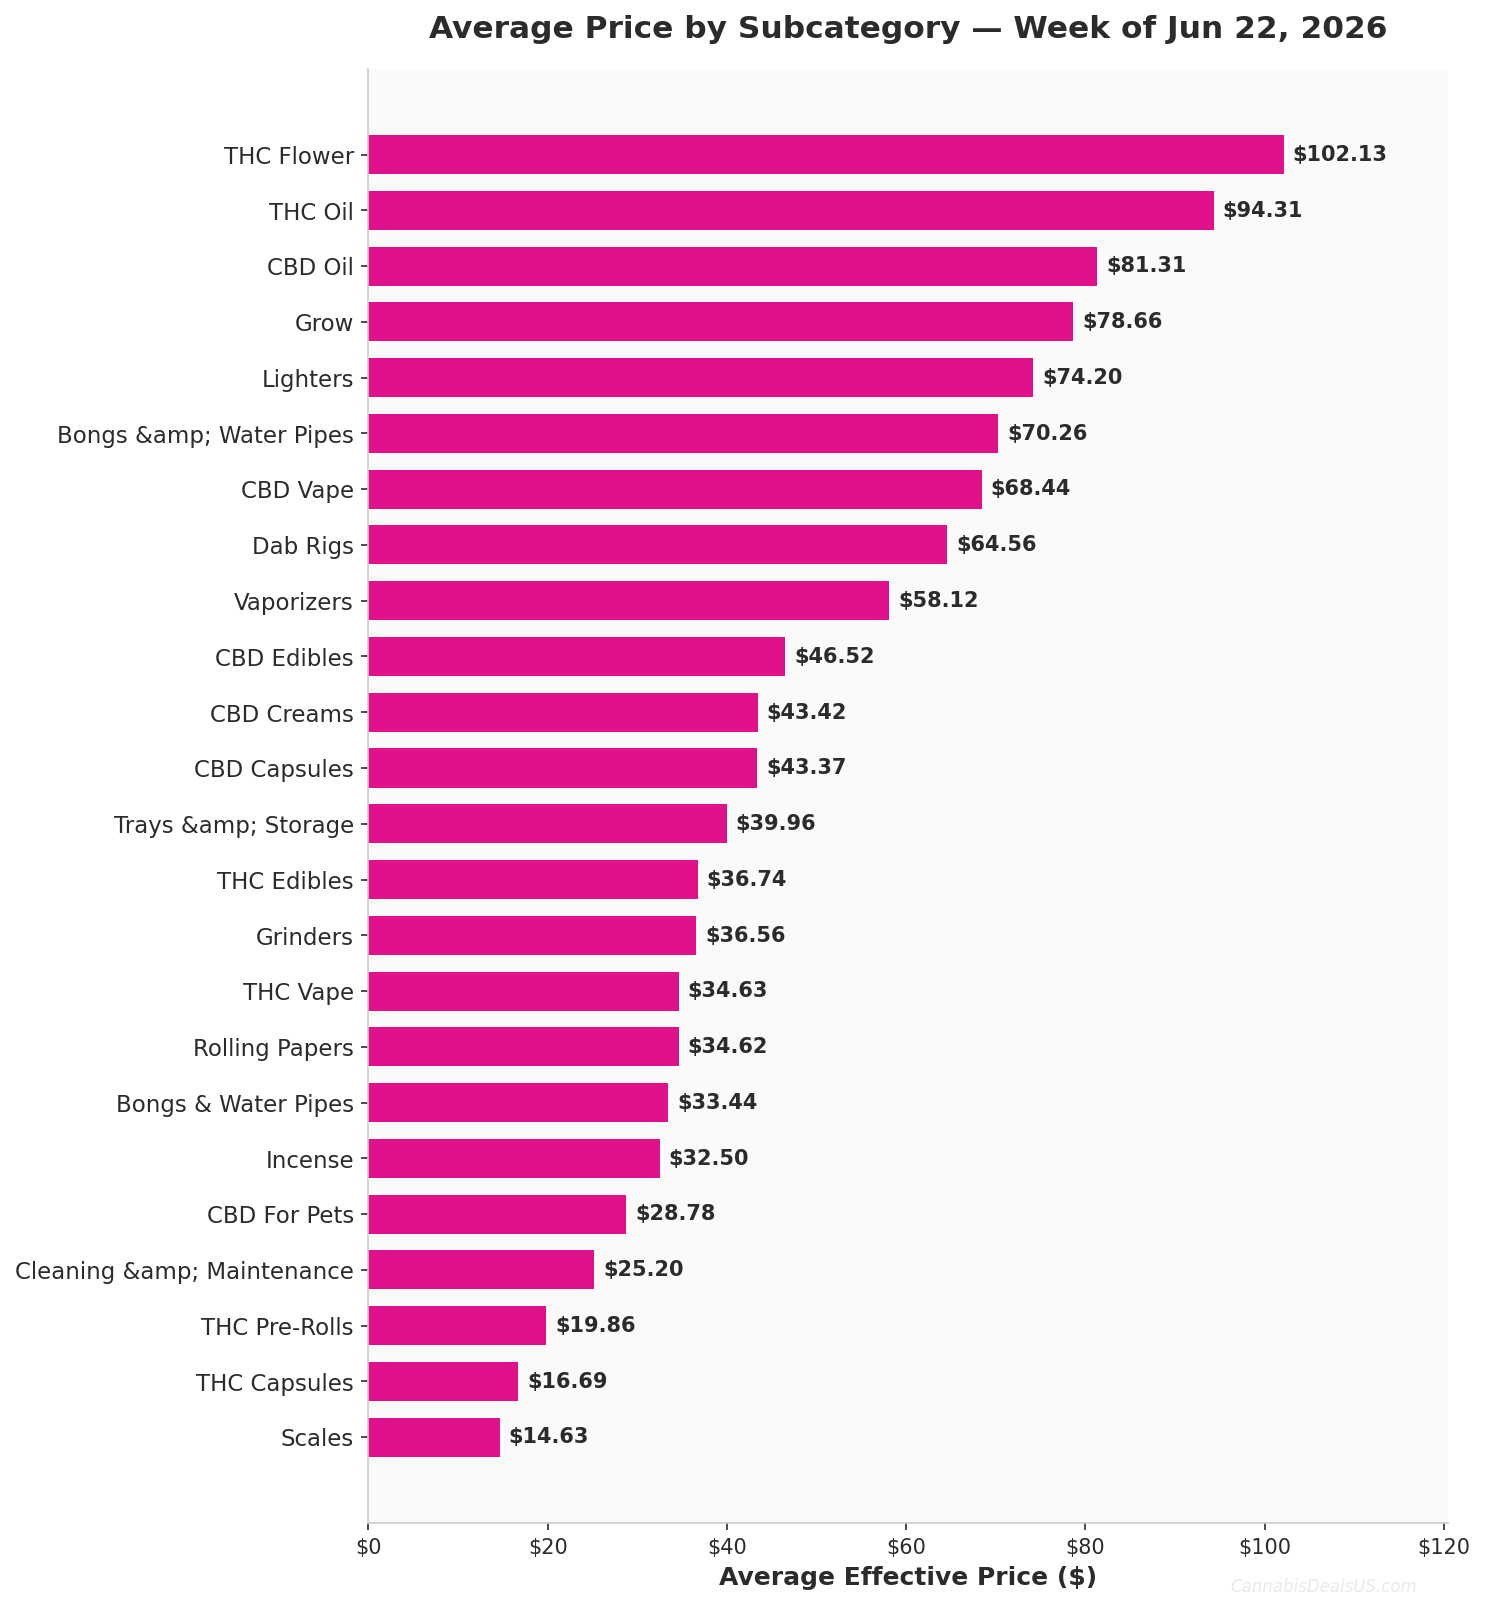
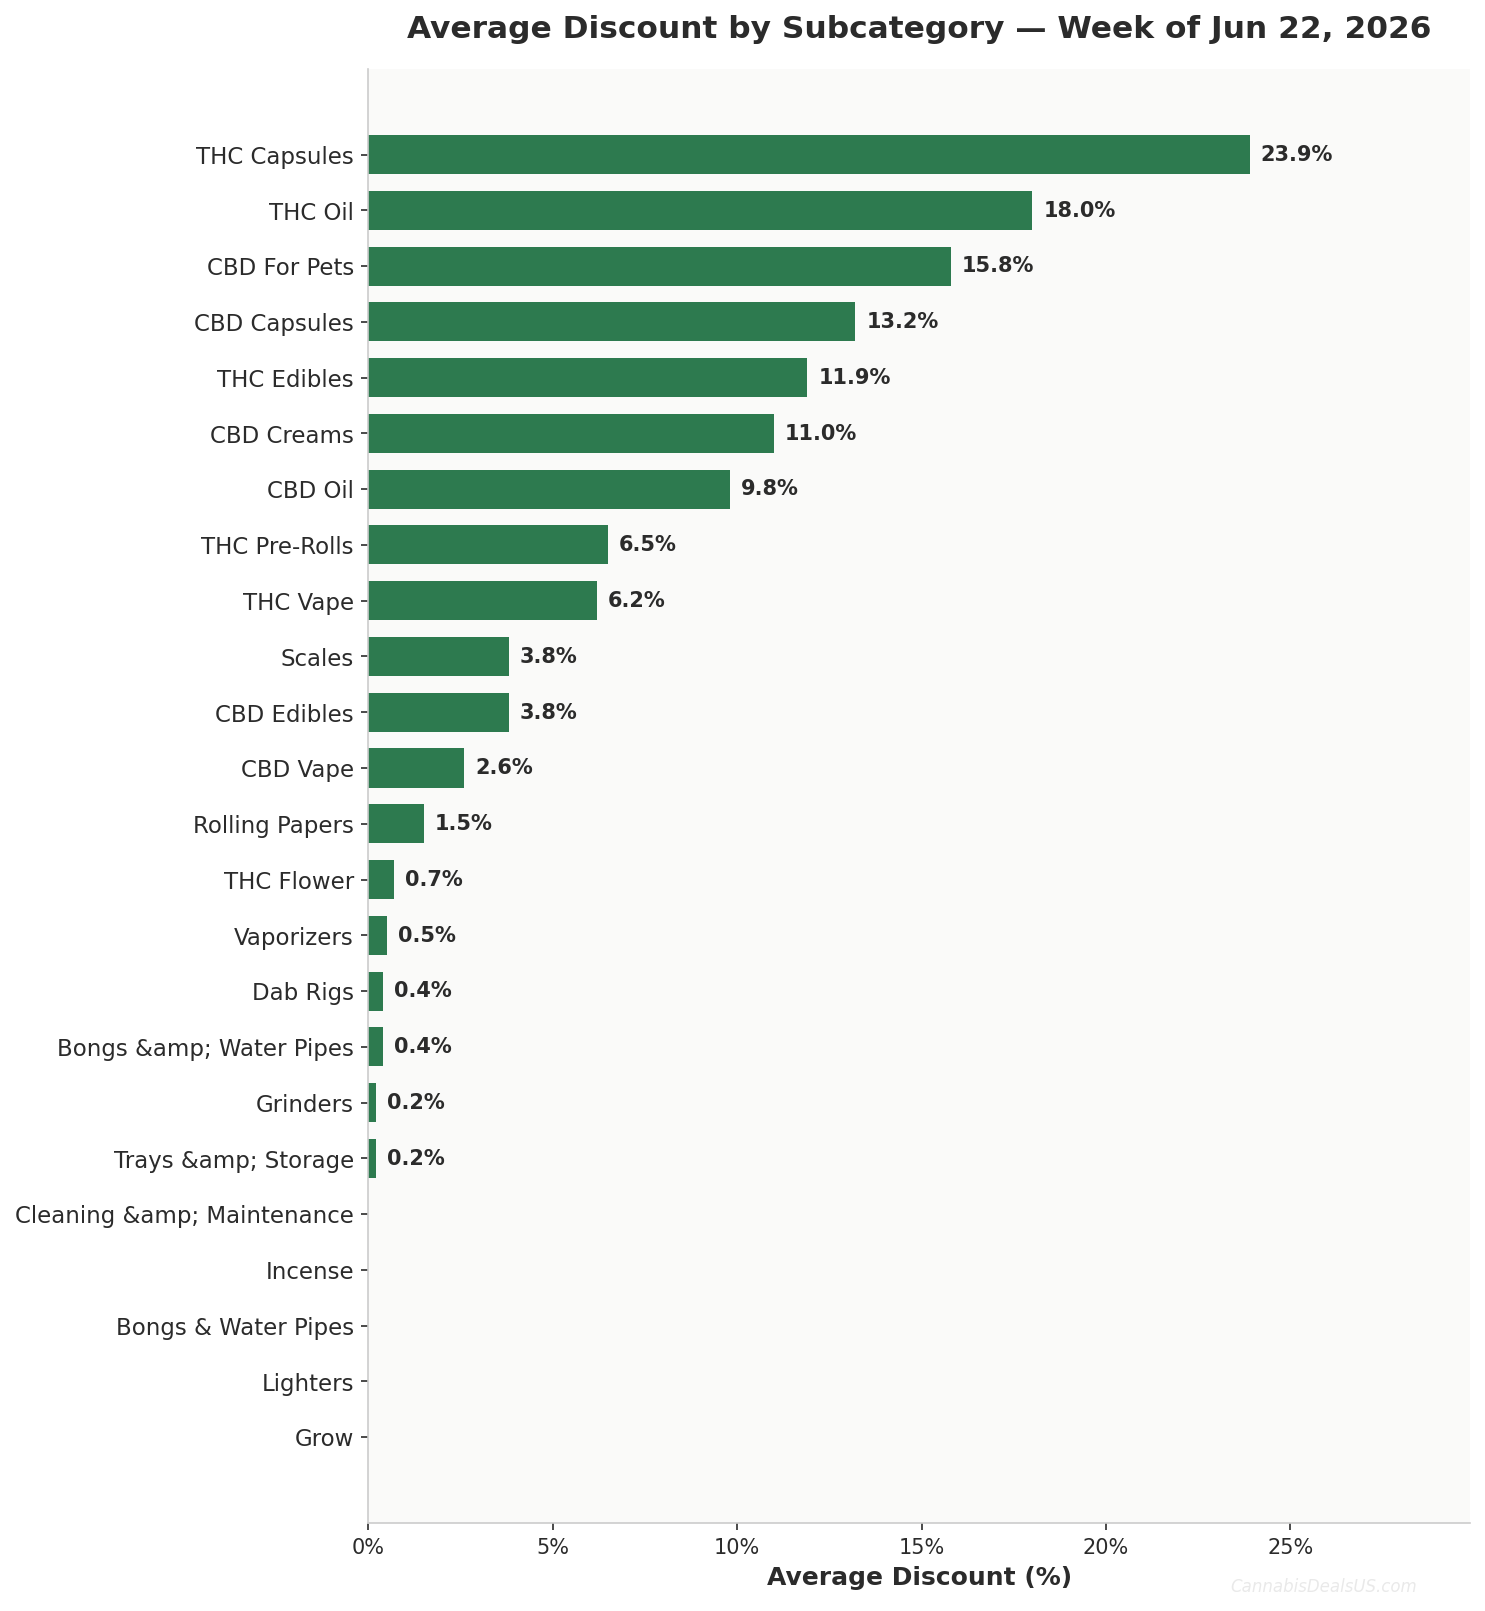
CBD Oil averages $65-$69 per product. CBD For Pets and Capsules carry the heaviest promotions (33-45% discount rates). Limited WoW variance since baseline.
THC Pricing
43.6% of THC Edibles carry active discounts. THC Pre-Rolls lowest at $20.21 avg. THC Vape tracks 2,400+ SKUs at $36.27 avg.
Discount Patterns
Discount rate: 11.7% (Dec 2025) to 8.2% (Mar 2026). Depth eased from ~40% to 36%. Consumables heaviest; hardware <5%.
Market Signals
Composite index holds 94.62-96.79 range over 13 weeks. Equilibrium ~4% below Dec 2025. Promotional activity contracting.
For Researchers
Methodology
Aggregated advertised pricing data collected weekly from online cannabis product listings.
Cite This Index
CannabisDealsUS Cannabis Price Index.

Primary source: cannabisdealsus.com/cannabis-price-index/

Dataset DOI: 10.5281/zenodo.18351090

Methodology DOI: 10.5281/zenodo.18851438

License: CC BY-NC 4.0
Access the Dataset
CC BY-NC 4.0 licensed. Versioned on Zenodo.
Related Guides
Cannabis Pricing Insights
The complete guide to understanding cannabis pricing trends, discount patterns, and market dynamics tracked by the CPI.
How the Cannabis Price Index Works
Data collection, equal-weighted index construction, and the weekly publication cycle explained.
CPI Use Cases
How the CPI is applied across academic research, journalism, policy analysis, and market intelligence.
Cannabis Prices Across the US
How cannabis prices compare across US states, with national price ranges by product type from CPI data.
CPI Reference Pages
Supporting data and reference pages published alongside the weekly Cannabis Price Index.
Online Cannabis Price Benchmarks
Per-unit price benchmarks for THC flower, vapes, edibles, and CBD oil. Tracked weekly across 35,000+ products.
Cannabis Price Trends by Month
Monthly price movement patterns across all major cannabinoid categories. Updated as new CPI data is published.
Cannabis Price Index Archive
Complete archive of all weekly CPI reports published since December 2025. Full dataset on Zenodo (CC BY-NC 4.0).
Frequently Asked Questions
Updated every Monday morning at 6:00 AM EST. Weekly update articles are typically published by Monday afternoon. Monthly comprehensive reports are released on the first Monday of each month.
Over 30,000+ products across CBD, THC (Delta-8, Delta-9, THCA, HHC), vaporizers, and headshop categories from 200+ verified US merchants shipping nationwide under the Farm Bill framework.
Multi-layer verification including automated outlier detection, manual anomaly checks, and cross-retailer comparison. Approximately 2-3% of data points are excluded weekly as errors or outliers.
Yes. Archives dating to December 2025 are available via Zenodo (DOI-versioned) or by direct request for research and media purposes.
Cannabis industry journalists, financial analysts, academic researchers, dispensary operators, and brands benchmarking competitive pricing. Cited by Ganjapreneur, Cannigma, Markets Herald, and The Marijuana Herald.
Last Updated on May 5, 2026 by CannabisDealsUS Editorial Team